Technical Analysis of PXDT 2024-05-10
Overview:
In analyzing the technical indicators for PXDT over the last 5 days, we will delve into the trend, momentum, volatility, and volume indicators to provide a comprehensive outlook on the possible stock price movement in the coming days. By examining these key aspects, we aim to offer valuable insights and predictions to guide your investment decisions.
Trend Analysis:
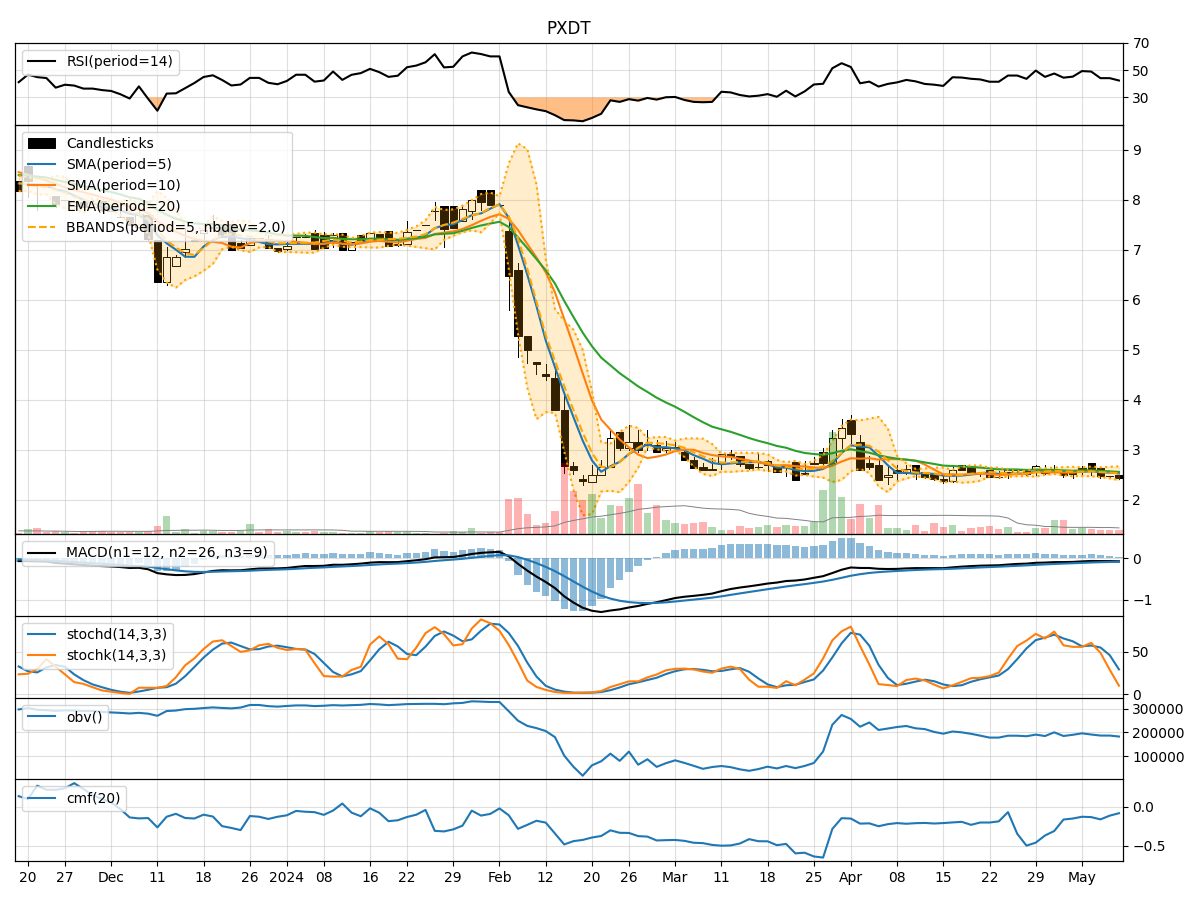
- Moving Averages (MA): The 5-day Moving Average (MA) has been declining steadily, indicating a bearish trend in the short term.
- MACD: The Moving Average Convergence Divergence (MACD) is negative, suggesting a bearish momentum in the stock.
- EMA: The Exponential Moving Average (EMA) is also trending downwards, reinforcing the bearish sentiment in the stock.
Momentum Analysis:
- RSI: The Relative Strength Index (RSI) is hovering around 50, indicating a neutral momentum with no clear direction.
- Stochastic Oscillator: Both %K and %D of the Stochastic Oscillator are in oversold territory, signaling a potential reversal or consolidation.
- Williams %R: The Williams %R is deeply in oversold territory, suggesting a possible bounce back in the stock price.
Volatility Analysis:
- Bollinger Bands: The Bollinger Bands are narrowing, indicating decreasing volatility and a potential period of consolidation.
- Bollinger %B: The %B indicator is below 0.2, suggesting the stock is oversold and may see a reversal in the near future.
Volume Analysis:
- On-Balance Volume (OBV): The OBV has been consistently negative, indicating selling pressure in the stock.
- Chaikin Money Flow (CMF): The CMF is also negative, reflecting a bearish sentiment in the stock.
Key Observations:
- The stock is currently in a bearish trend based on moving averages and MACD.
- Momentum indicators suggest a potential reversal or consolidation in the near term.
- Volatility is decreasing, indicating a period of consolidation may be imminent.
- Volume indicators confirm the bearish sentiment with consistent selling pressure.
Conclusion:
Based on the analysis of the technical indicators, the stock is likely to experience further downward movement in the short term. Traders should exercise caution and consider waiting for a clearer signal of a reversal before considering any long positions. The stock may enter a consolidation phase before any significant price movement. It is advisable to closely monitor the momentum indicators for signs of a potential trend reversal.