Technical Analysis of PXS 2024-05-10
Overview:
In analyzing the technical indicators for PXS over the last 5 days, we will delve into the trend, momentum, volatility, and volume indicators to provide a comprehensive outlook on the possible stock price movement in the coming days. By examining these key aspects, we aim to offer valuable insights and predictions for informed decision-making.
Trend Analysis:
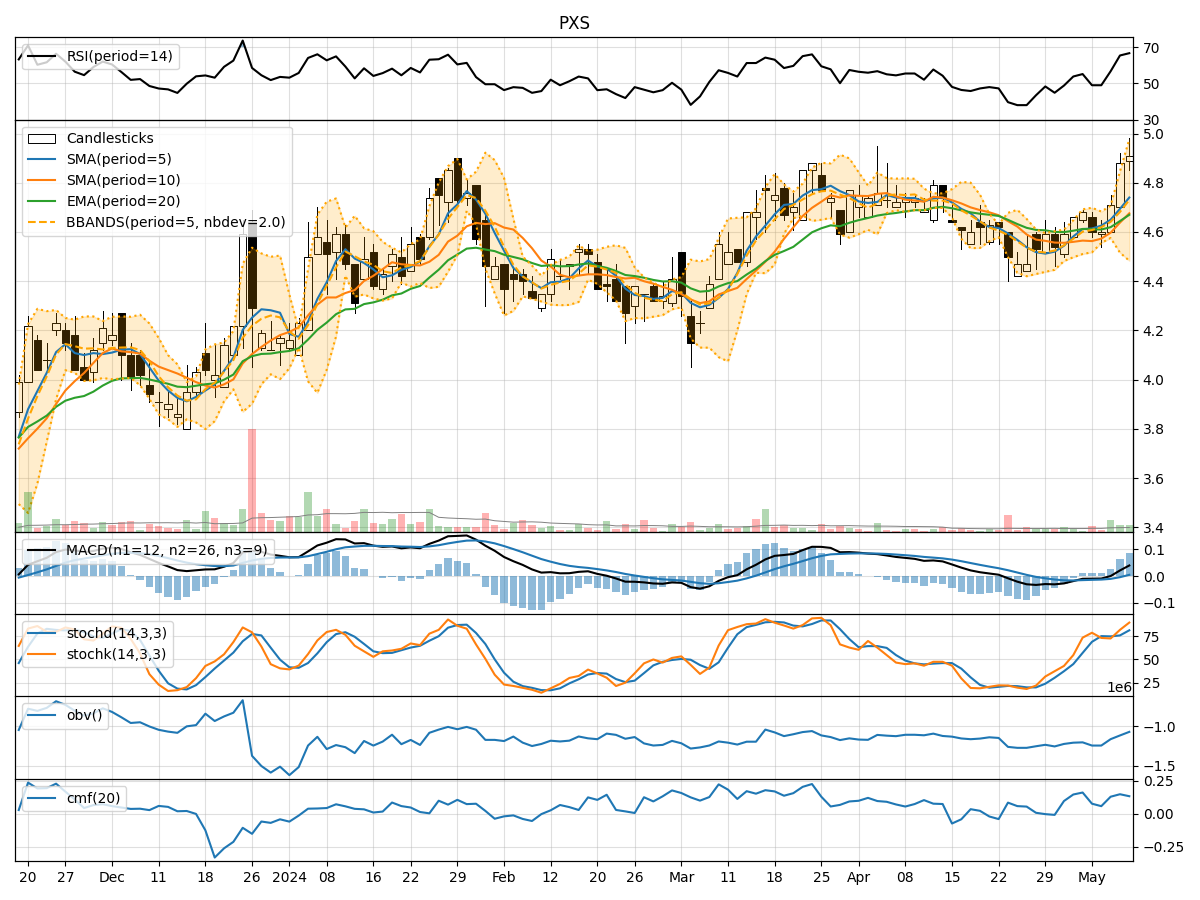
- Moving Averages (MA): The 5-day MA has been showing an upward trend, indicating a positive momentum in the stock price.
- MACD: The MACD line has been consistently above the signal line, suggesting a bullish trend.
- RSI: The RSI has been increasing, reflecting growing buying pressure in the market.
Key Observation: The trend indicators point towards a bullish sentiment in the stock price movement.
Momentum Analysis:
- Stochastic Oscillator: Both %K and %D have been rising, indicating increasing buying momentum.
- Williams %R: The indicator has been fluctuating but remains in the oversold territory, suggesting a potential reversal.
Key Observation: Momentum indicators signal a positive momentum in the stock price.
Volatility Analysis:
- Bollinger Bands: The bands have been widening, indicating increased volatility in the stock price.
- Volatility Percentage: The volatility percentage has been fluctuating, reflecting the dynamic nature of price movements.
Key Observation: Volatility indicators suggest increased price fluctuations in the stock.
Volume Analysis:
- On-Balance Volume (OBV): The OBV has been steadily increasing, indicating accumulation by investors.
- Chaikin Money Flow (CMF): The CMF has been positive, showing money flow into the stock.
Key Observation: Volume indicators point towards positive buying pressure in the stock.
Conclusion:
Based on the analysis of trend, momentum, volatility, and volume indicators, the overall outlook for PXS stock is bullish. The positive trend, momentum, increasing buying pressure, and accumulation by investors indicate a potential upward movement in the stock price in the coming days. Investors may consider buying or holding positions in PXS based on the technical analysis provided.
Disclaimer:
This analysis is based solely on technical indicators and historical data. It is essential to consider other fundamental factors and market dynamics before making investment decisions. Consult with a financial advisor for personalized advice tailored to your investment goals and risk tolerance.