Technical Analysis of PYCR 2024-05-10
Overview:
In analyzing the technical indicators for PYCR over the last 5 days, we will delve into the trend, momentum, volatility, and volume indicators to provide a comprehensive outlook on the possible stock price movement in the coming days. By examining these key aspects, we aim to offer valuable insights and predictions for potential investors.
Trend Indicators:
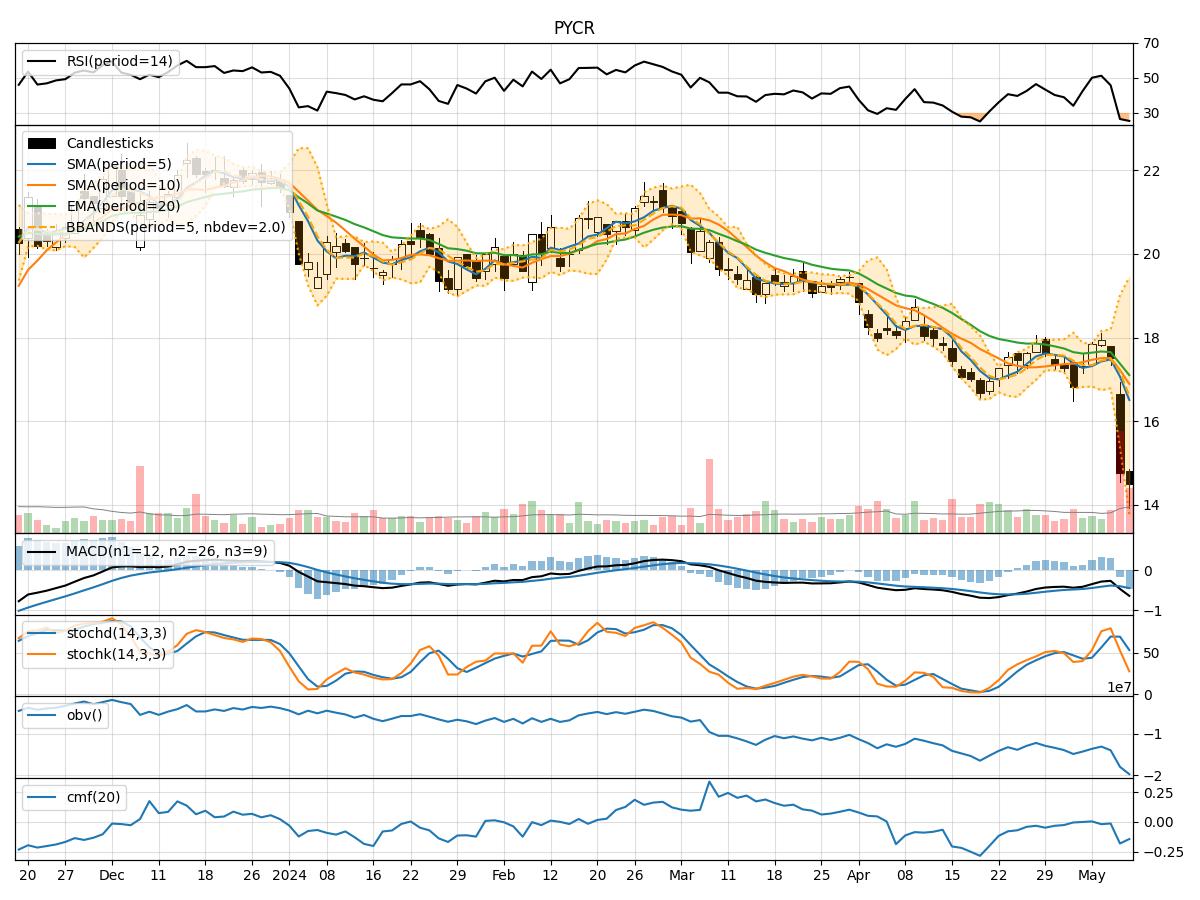
- Moving Averages (MA): The 5-day MA has been below the closing prices, indicating a short-term bearish trend.
- MACD: The MACD line has been consistently below the signal line, suggesting a bearish momentum.
- EMA: The EMA has been declining, reflecting a downward trend in the stock price.
Momentum Indicators:
- RSI: The RSI has been hovering around the neutral zone, indicating a lack of strong momentum.
- Stochastic Oscillator: The stochastic indicators have shown a mix of overbought and oversold conditions, signaling potential reversals.
- Williams %R: The Williams %R has been in oversold territory, suggesting a possible bullish reversal.
Volatility Indicators:
- Bollinger Bands (BB): The narrowing of the Bollinger Bands indicates decreasing volatility and a potential period of consolidation.
- BB %B: The %B indicator is close to 0, suggesting the stock is trading near the lower band and may be oversold.
Volume Indicators:
- On-Balance Volume (OBV): The OBV has been consistently negative, indicating selling pressure and bearish sentiment.
- Chaikin Money Flow (CMF): The CMF has been negative, reflecting a lack of buying interest and potential outflow of money from the stock.
Key Observations and Opinions:
- Trend: The trend indicators point towards a bearish sentiment in the stock price.
- Momentum: The momentum indicators show mixed signals, with potential for a bullish reversal based on oversold conditions.
- Volatility: Volatility is decreasing, suggesting a period of consolidation or a potential breakout.
- Volume: The negative OBV and CMF indicate bearish sentiment and lack of buying interest.
Conclusion:
Based on the analysis of the technical indicators, the stock price of PYCR is likely to experience further downward movement in the coming days. The bearish trend, coupled with negative volume indicators and lackluster momentum, indicates a challenging outlook for the stock. Traders should exercise caution and consider waiting for more definitive signals before considering any long positions.