Technical Analysis of PYPD 2024-05-10
Overview:
In analyzing the technical indicators for PYPD over the last 5 days, we will delve into the trend, momentum, volatility, and volume indicators to provide a comprehensive outlook on the possible stock price movement in the coming days. By examining these key aspects, we aim to offer valuable insights and predictions to guide your investment decisions.
Trend Analysis:
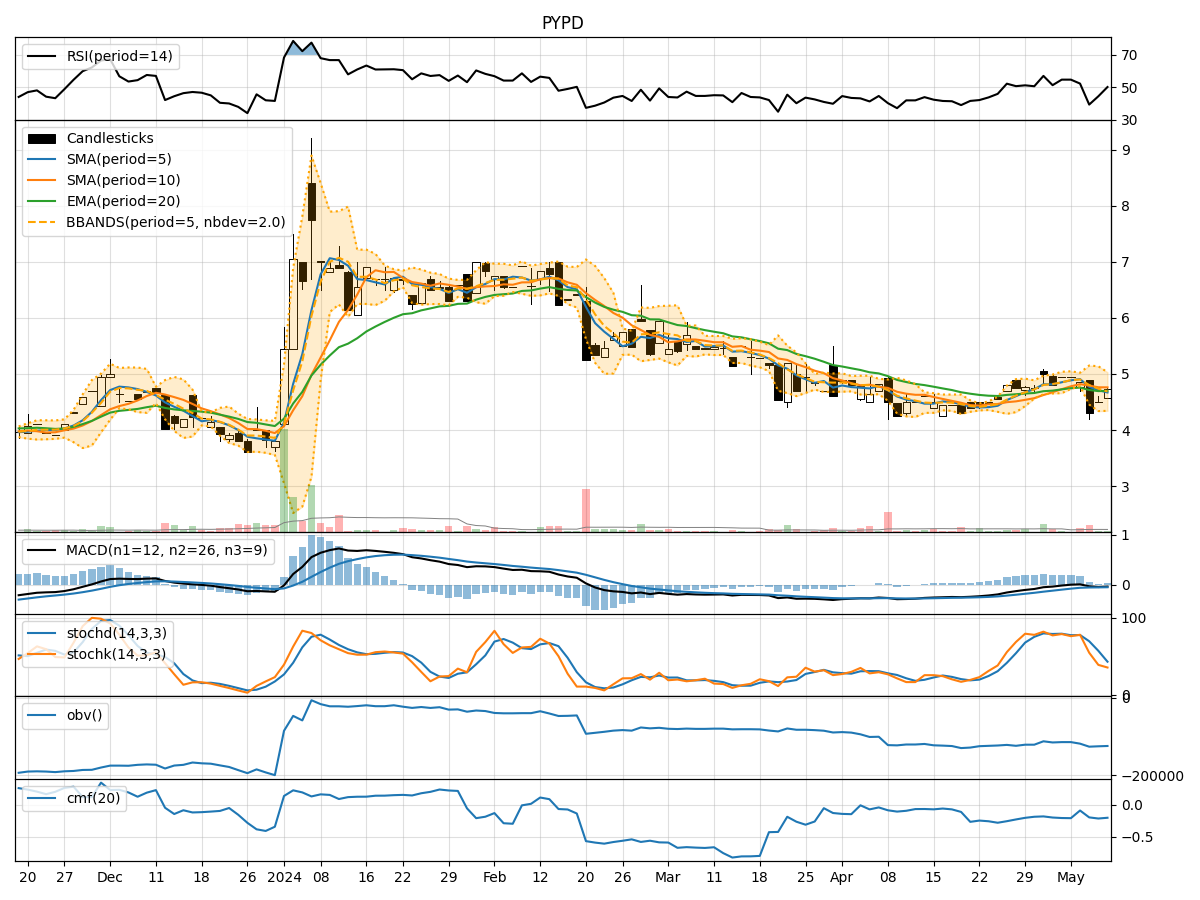
- Moving Averages (MA): The 5-day Moving Average (MA) has been fluctuating around the closing prices, indicating short-term price trends. The Simple Moving Average (SMA) and Exponential Moving Average (EMA) show a mixed trend, with the EMA slightly below the SMA.
- MACD: The Moving Average Convergence Divergence (MACD) has been negative, suggesting a bearish momentum in the stock price. The MACD Histogram (MACDH) has been positive but decreasing, indicating a potential reversal.
Momentum Analysis:
- RSI: The Relative Strength Index (RSI) has been fluctuating around the midline, indicating a lack of strong momentum in either direction.
- Stochastic Oscillator: Both %K and %D of the Stochastic Oscillator have been declining, signaling a bearish momentum in the stock.
- Williams %R: The Williams %R is in the oversold territory, suggesting a potential reversal or bounce in the stock price.
Volatility Analysis:
- Bollinger Bands (BB): The Bollinger Bands have been narrowing, indicating decreasing volatility in the stock price. The %B indicator is below 0.5, suggesting a potential oversold condition.
- Average True Range (ATR): The ATR has been decreasing, indicating lower volatility in the stock.
Volume Analysis:
- On-Balance Volume (OBV): The OBV has been declining, indicating selling pressure in the stock.
- Chaikin Money Flow (CMF): The CMF has been negative, suggesting a lack of buying interest in the stock.
Key Observations:
- The trend indicators show a bearish bias with the MACD signaling a potential reversal.
- Momentum indicators indicate a bearish sentiment with oversold conditions.
- Volatility indicators suggest decreasing volatility and a potential oversold condition.
- Volume indicators point towards selling pressure and a lack of buying interest.
Conclusion:
Based on the analysis of the technical indicators, the stock price of PYPD is likely to experience further downward movement in the coming days. The bearish trend, negative momentum, decreasing volatility, and selling pressure indicated by the volume indicators all point towards a continuation of the current downtrend. Investors should exercise caution and consider waiting for more favorable conditions before considering any long positions.