Technical Analysis of PYPL 2024-05-10
Overview:
In analyzing the technical indicators for PayPal (PYPL) over the last 5 days, we will delve into the trend, momentum, volatility, and volume indicators to provide a comprehensive outlook on the possible stock price movement. By examining these key factors, we aim to offer valuable insights and predictions for the upcoming days.
Trend Indicators:
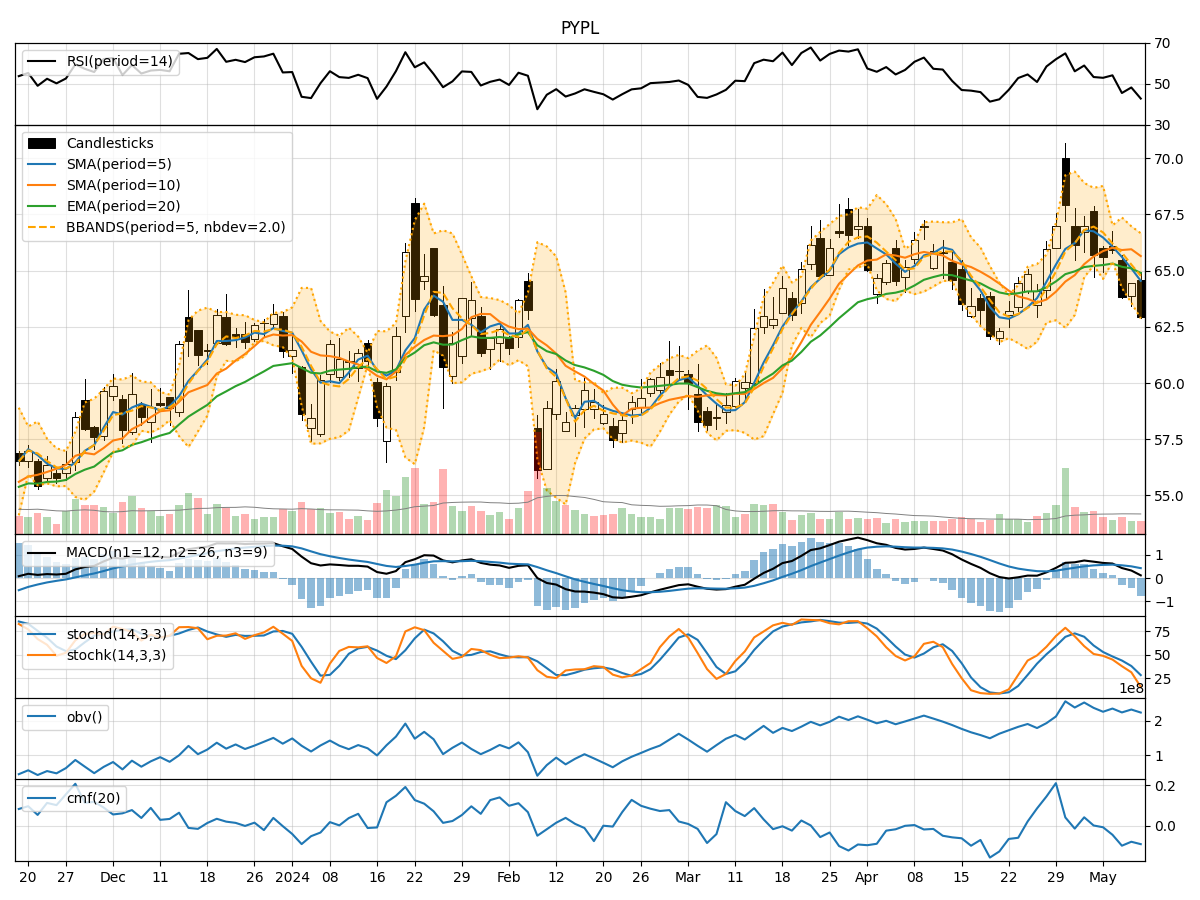
- Moving Averages (MA): The 5-day MA has been consistently below the closing price, indicating a short-term downtrend.
- MACD: The MACD line has been positive but decreasing, while the MACD Histogram has been negative, suggesting a weakening bullish momentum.
- EMA: The EMA has been below the closing price, reflecting a bearish sentiment.
Momentum Indicators:
- RSI: The RSI has been fluctuating around the neutral 50 level, indicating indecision in the market.
- Stochastic Oscillator: Both %K and %D have been declining, signaling a potential bearish momentum.
- Williams %R: The indicator has been in oversold territory, suggesting a possible reversal.
Volatility Indicators:
- Bollinger Bands: The price has been trading within the bands, with the lower band acting as support.
- Bollinger %B: The %B indicator has been hovering around the midpoint, indicating a balanced volatility level.
Volume Indicators:
- On-Balance Volume (OBV): The OBV has been fluctuating, showing no clear direction in volume accumulation.
- Chaikin Money Flow (CMF): The CMF has been negative, indicating selling pressure in the market.
Key Observations:
- The trend indicators suggest a short-term bearish sentiment, with the moving averages and MACD signaling a potential downtrend.
- Momentum indicators show mixed signals, with the RSI indicating neutrality, while the Stochastic Oscillator and Williams %R point towards a bearish bias.
- Volatility remains relatively stable, with the Bollinger Bands not showing any extreme movements.
- Volume indicators reflect uncertainty, as OBV fluctuates without a clear trend, and CMF indicates selling pressure.
Conclusion:
Based on the analysis of the technical indicators, the outlook for PayPal (PYPL) in the next few days leans towards a continuation of the current bearish trend. The weakening momentum, bearish trend signals, and selling pressure indicated by volume indicators suggest that the stock price may experience further downside movement. Traders and investors should exercise caution and consider implementing risk management strategies in anticipation of potential price declines.