Technical Analysis of QDEL 2024-05-10
Overview:
In analyzing the technical indicators for QDEL over the last 5 days, we will delve into the trend, momentum, volatility, and volume indicators to provide a comprehensive outlook on the possible stock price movement in the coming days.
Trend Indicators:
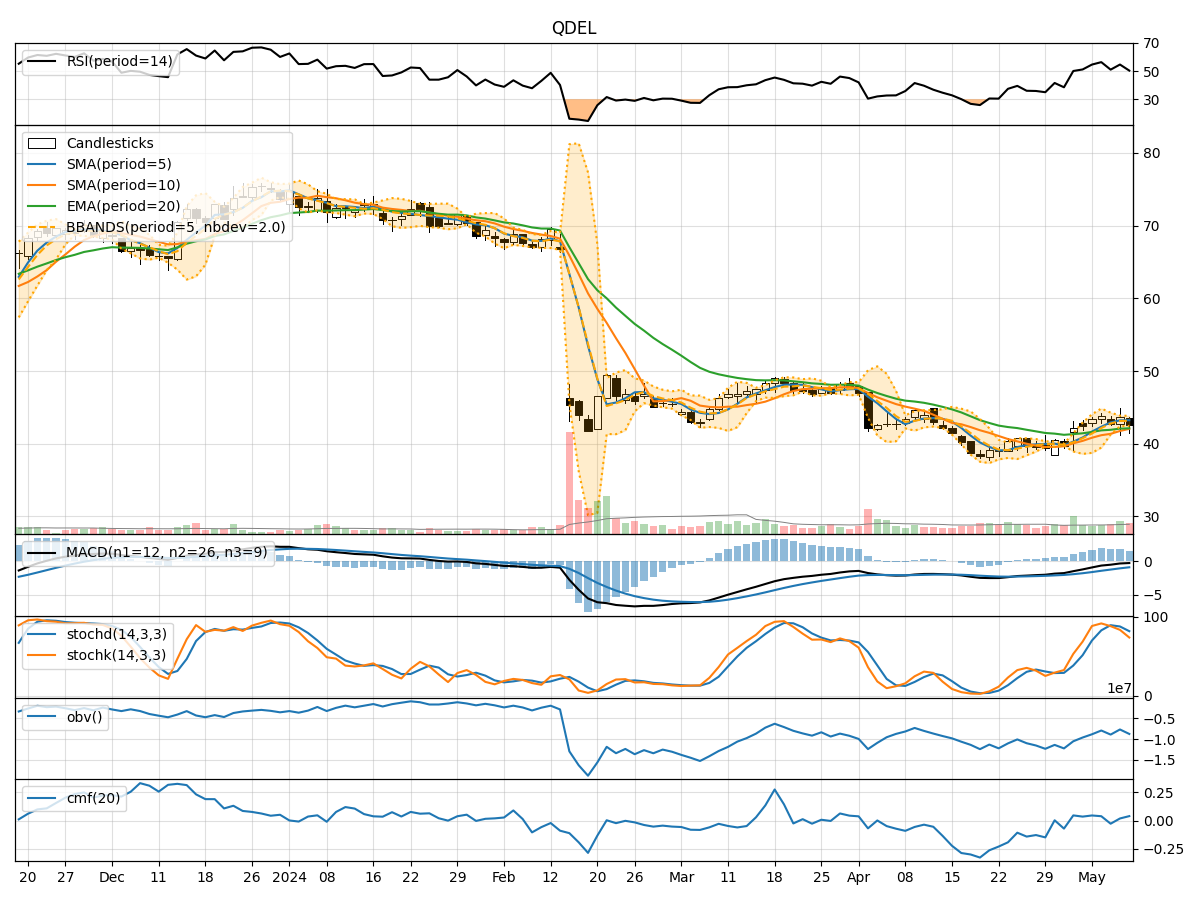
- Moving Averages (MA): The 5-day Moving Average (MA) has been consistently above the longer-term Simple Moving Average (SMA) and Exponential Moving Average (EMA), indicating a short-term bullish trend.
- MACD: The Moving Average Convergence Divergence (MACD) has shown positive values, with the MACD line consistently above the signal line, suggesting bullish momentum.
- Conclusion: The trend indicators point towards an upward trend in the stock price.
Momentum Indicators:
- RSI: The Relative Strength Index (RSI) has been fluctuating around the neutral level of 50, indicating a balanced momentum.
- Stochastic Oscillator: The Stochastic Oscillator shows values in the neutral to overbought territory, suggesting a potential overbought condition.
- Conclusion: The momentum indicators suggest a neutral momentum in the stock price.
Volatility Indicators:
- Bollinger Bands: The Bollinger Bands have shown narrowing bands, indicating decreasing volatility.
- Conclusion: Volatility indicators signal a decreasing volatility in the stock price.
Volume Indicators:
- On-Balance Volume (OBV): The OBV has been fluctuating, indicating mixed buying and selling pressure.
- Chaikin Money Flow (CMF): The CMF has shown positive values, suggesting accumulation.
- Conclusion: Volume indicators reflect mixed buying and selling pressure.
Key Observations:
- The trend indicators suggest an upward trend, supported by the positive MACD values.
- Momentum indicators indicate a neutral momentum, with RSI around 50 and stochastic values in the neutral to overbought zone.
- Volatility indicators point towards decreasing volatility, as seen in the narrowing Bollinger Bands.
- Volume indicators show mixed buying and selling pressure, with fluctuating OBV and positive CMF values.
Conclusion:
Based on the analysis of the technical indicators, the next few days' possible stock price movement for QDEL is likely to be upward with decreasing volatility. However, the neutral momentum and mixed volume signals suggest a cautious approach. Traders and investors should monitor the stock closely for any signs of reversal or consolidation.