Technical Analysis of QH 2024-05-10
Overview:
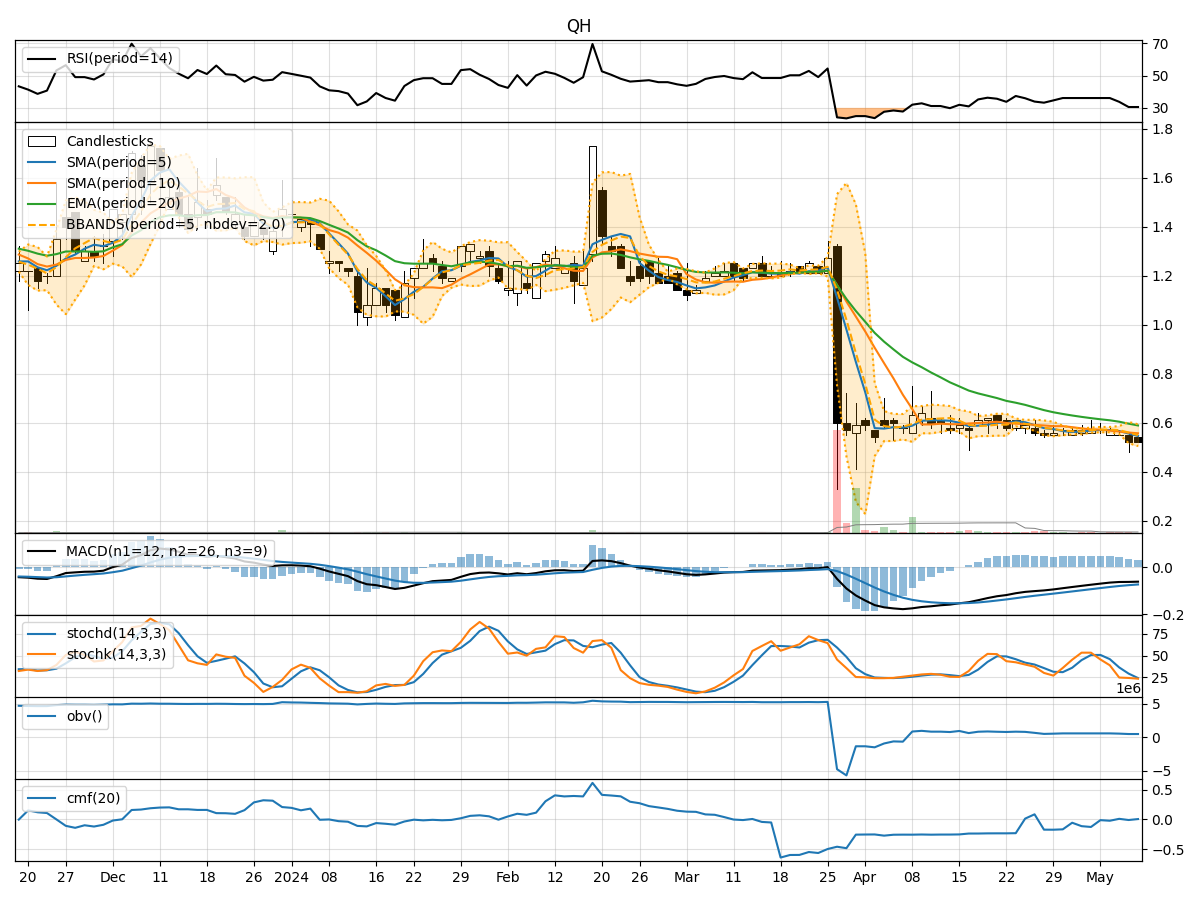
In analyzing the technical indicators for QH stock over the last 5 days, we will delve into the trend, momentum, volatility, and volume indicators to provide a comprehensive outlook on the possible stock price movement in the coming days. By examining these key indicators, we aim to offer valuable insights and predictions for informed decision-making.
Trend Analysis:
- Moving Averages (MA): The 5-day MA has been consistently decreasing, indicating a downward trend in the stock price.
- MACD: The MACD line has been negative, suggesting bearish momentum in the stock.
- EMA: The exponential moving average has also been declining, reinforcing the bearish sentiment in the stock.
Momentum Analysis:
- RSI: The RSI has been decreasing, reflecting a weakening momentum in the stock.
- Stochastic Oscillator: Both %K and %D have been declining, indicating a bearish momentum.
- Williams %R: The indicator has been in the oversold territory, signaling a potential reversal or continuation of the downtrend.
Volatility Analysis:
- Bollinger Bands: The stock price has been trading below the lower Bollinger Band, suggesting oversold conditions.
- Bollinger %B: The %B indicator has been below 0.2, indicating a potential oversold situation.
- Volatility: The volatility has been increasing, which may lead to larger price swings in the coming days.
Volume Analysis:
- On-Balance Volume (OBV): The OBV has been decreasing, indicating selling pressure in the stock.
- Chaikin Money Flow (CMF): The CMF has been negative, suggesting outflow of money from the stock.
Key Observations:
- The stock is currently in a downtrend based on moving averages and MACD.
- Momentum indicators like RSI and Stochastic Oscillator are showing bearish signals.
- Volatility has increased, potentially leading to heightened price fluctuations.
- Volume indicators reflect selling pressure and negative money flow.
Conclusion:
Based on the analysis of the technical indicators, the next few days for QH stock are likely to see further downward movement. The stock is currently in a bearish phase, with indicators pointing towards continued selling pressure and a potential oversold condition. Traders and investors should exercise caution and consider waiting for signs of a reversal or stabilization before considering any long positions.