Technical Analysis of QLYS 2024-05-10
Overview:
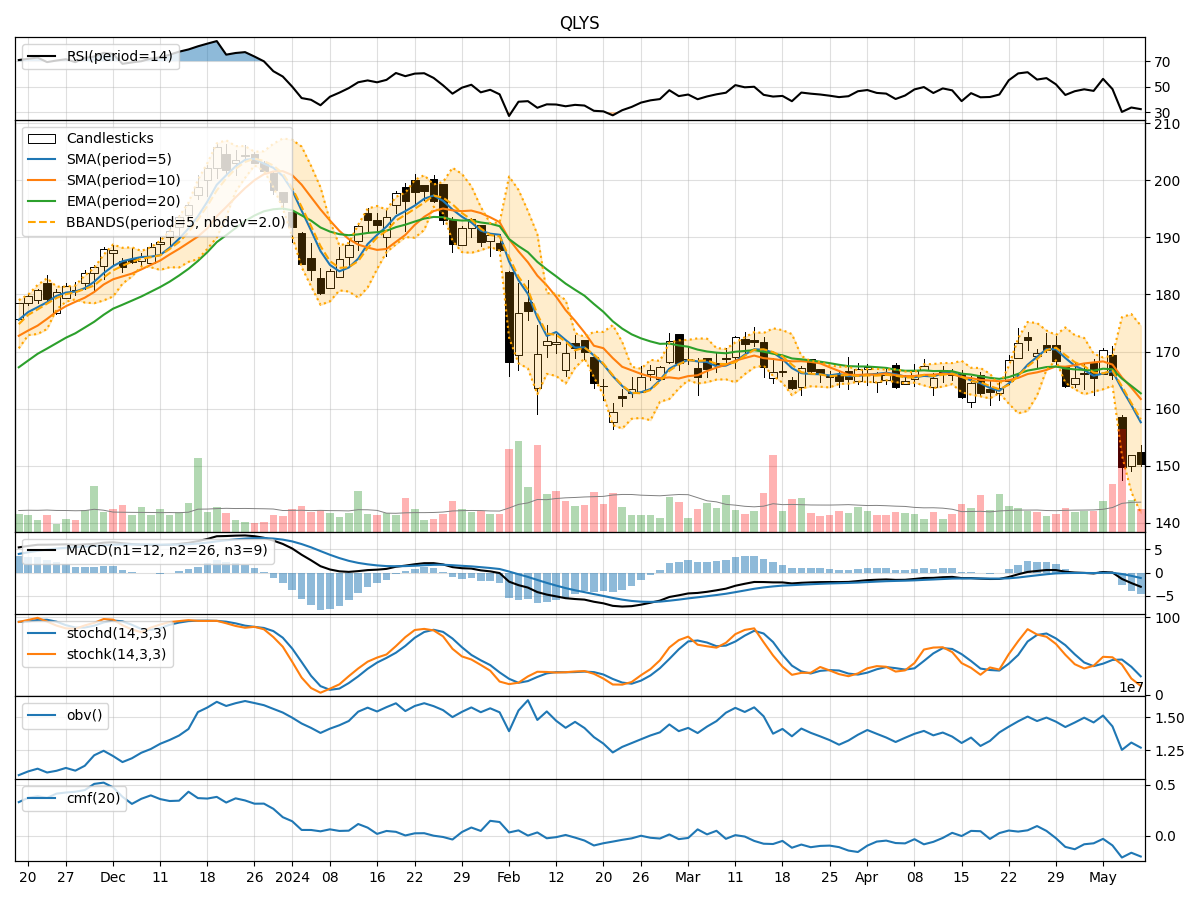
In analyzing the technical indicators for QLYS over the last 5 days, we will delve into the trend, momentum, volatility, and volume indicators to provide a comprehensive outlook on the possible stock price movement in the coming days.
Trend Analysis:
- Moving Averages (MA): The 5-day MA has been consistently below the closing prices, indicating a short-term downtrend.
- MACD: The MACD line has been decreasing, with the MACD histogram also showing a downward trend, suggesting a bearish momentum.
- EMA: The EMA has been declining, further supporting the bearish trend.
Momentum Analysis:
- RSI: The RSI has been decreasing, indicating weakening momentum.
- Stochastic Oscillator: Both %K and %D have been falling, signaling a bearish momentum.
- Williams %R: The indicator has been in oversold territory, suggesting a potential reversal.
Volatility Analysis:
- Bollinger Bands (BB): The stock price has been consistently below the lower Bollinger Band, indicating oversold conditions.
- Bollinger Band Width (BBW): The BBW has been widening, suggesting increased volatility.
- Bollinger Band %B (BBP): The %B has been below 0.2, indicating potential oversold conditions.
Volume Analysis:
- On-Balance Volume (OBV): The OBV has been declining, indicating selling pressure.
- Chaikin Money Flow (CMF): The CMF has been negative, suggesting outflow of money from the stock.
Key Observations:
- The stock is currently in a downtrend based on moving averages and MACD.
- Momentum indicators like RSI and Stochastic Oscillator are showing bearish signals.
- Volatility has increased, as seen in the widening Bollinger Bands.
- Volume indicators reflect selling pressure with declining OBV and negative CMF.
Conclusion:
Based on the analysis of the technical indicators, the next few days for QLYS are likely to see further downward movement. The stock is currently in a bearish phase, with momentum indicators supporting a continuation of the downtrend. Volatility is high, indicating potential for sharp price movements, likely on the downside. Volume indicators suggest that selling pressure is dominant in the market.
Recommendation:
Considering the overall bearish outlook, it is advisable to exercise caution if holding a long position or consider shorting the stock for potential gains. Traders should closely monitor key support levels and be prepared for increased volatility in the coming days. It is essential to have a risk management strategy in place to protect against potential downside risks.