Technical Analysis of QSG 2024-05-10
Overview:
In analyzing the technical indicators for QSG stock over the last 5 days, we will delve into the trend, momentum, volatility, and volume indicators to provide a comprehensive outlook on the possible stock price movement in the coming days. By examining these key indicators, we aim to offer valuable insights and predictions to guide investment decisions.
Trend Analysis:
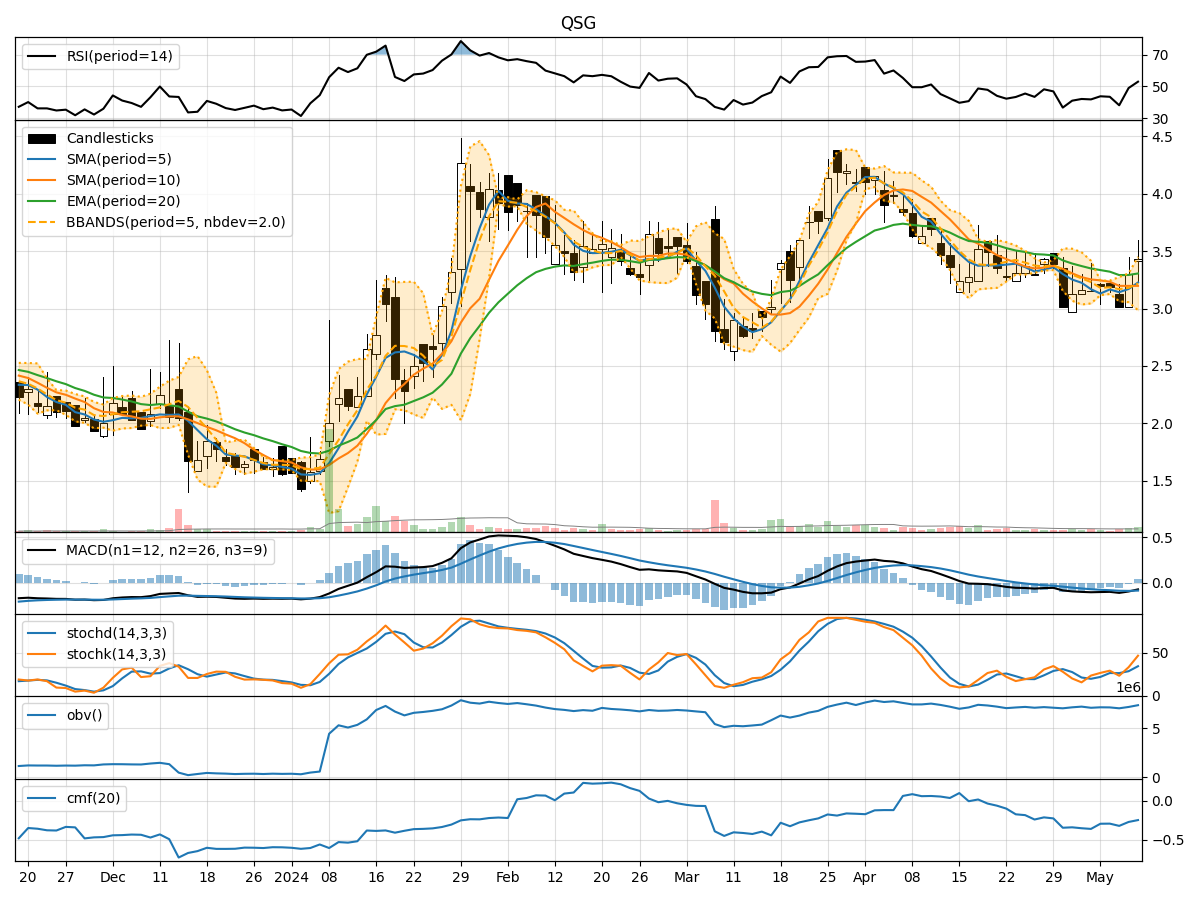
- Moving Averages (MA): The 5-day Moving Average (MA) has been fluctuating around the closing prices, indicating short-term price trends. The Simple Moving Average (SMA) and Exponential Moving Average (EMA) show a downward trend, suggesting a bearish sentiment in the market.
- MACD: The Moving Average Convergence Divergence (MACD) and its signal line (MACDH) have been negative, indicating a bearish momentum in the stock price.
Momentum Analysis:
- RSI: The Relative Strength Index (RSI) has been below 50, indicating a bearish momentum in the stock.
- Stochastic Oscillator: Both %K and %D have been below 50, suggesting a bearish sentiment in the stock price momentum.
Volatility Analysis:
- Bollinger Bands (BB): The Bollinger Bands have been narrowing, indicating decreasing volatility in the stock price. The bands are close to each other, suggesting a period of consolidation.
- Bollinger %B (BBP): The %B is below 1, indicating that the stock price is trading below the lower Bollinger Band, which could signal an oversold condition.
Volume Analysis:
- On-Balance Volume (OBV): The OBV has been fluctuating, indicating indecision in the market sentiment.
- Chaikin Money Flow (CMF): The CMF has been negative, suggesting a bearish money flow in the stock.
Conclusion:
Based on the analysis of the technical indicators, the stock price of QSG is likely to experience a further downward movement in the coming days. The trend indicators, momentum indicators, and volume indicators all point towards a bearish sentiment in the market. The narrowing Bollinger Bands and the oversold condition indicated by the Bollinger %B further support the likelihood of a continued downward trend.
Key Conclusion: Bearish sentiment is dominant across all indicators, indicating a high probability of further downside movement in the stock price. Investors should exercise caution and consider potential short-selling opportunities or wait for a more favorable entry point before considering long positions.