Technical Analysis of RDHL 2024-05-10
Overview:
In analyzing the technical indicators for RDHL over the last 5 days, we will delve into the trend, momentum, volatility, and volume indicators to provide a comprehensive outlook on the possible stock price movement in the coming days. By examining these key indicators, we aim to offer valuable insights and predictions for informed decision-making.
Trend Analysis:
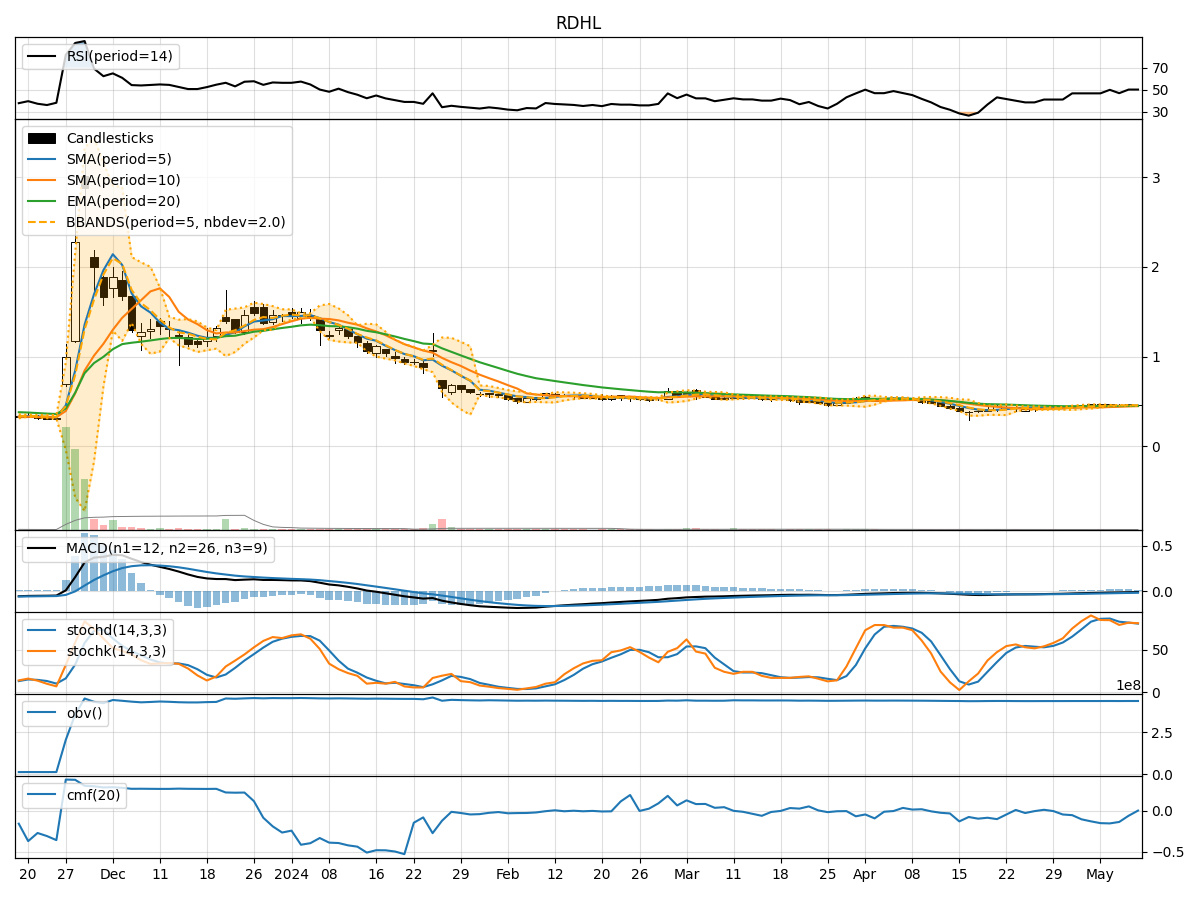
- Moving Averages (MA): The 5-day Moving Average (MA) has been relatively stable around $0.45-$0.46, indicating a neutral trend in the short term.
- MACD: The Moving Average Convergence Divergence (MACD) has shown a negative trend, with the MACD line consistently below the signal line, suggesting a bearish momentum.
- EMA: The Exponential Moving Average (EMA) has also been declining slightly, further supporting the bearish sentiment in the trend.
Momentum Analysis:
- RSI: The Relative Strength Index (RSI) has been hovering around 50, indicating a neutral momentum with no clear overbought or oversold conditions.
- Stochastic Oscillator: Both %K and %D of the Stochastic Oscillator have been fluctuating in the neutral zone, reflecting indecision in momentum.
- Williams %R: The Williams %R is also neutral, suggesting a lack of strong directional momentum.
Volatility Analysis:
- Bollinger Bands: The Bollinger Bands have shown a slight widening, indicating increased volatility, but the bands are still relatively close together, suggesting a potential consolidation phase.
- Bollinger %B: The %B indicator has been fluctuating around 0.5, signifying a balanced volatility level without extreme movements.
Volume Analysis:
- On-Balance Volume (OBV): The OBV has been relatively flat, indicating no significant accumulation or distribution of the stock.
- Chaikin Money Flow (CMF): The CMF has been negative, suggesting a slight outflow of money from the stock over the past few days.
Key Observations:
- The trend indicators point towards a bearish sentiment, with the MACD and EMA showing a downward trend.
- Momentum indicators suggest a lack of clear direction, with RSI, Stochastic Oscillator, and Williams %R all indicating neutral momentum.
- Volatility indicators show a slight increase in volatility but not significant enough to indicate a strong trend.
- Volume indicators reflect a lack of significant buying or selling pressure, with OBV and CMF remaining relatively flat.
Conclusion:
Based on the analysis of the technical indicators, the overall outlook for RDHL in the next few days is likely to be sideways with a slightly bearish bias. The stock may experience some consolidation within the current price range of $0.45-$0.46, with limited upside potential in the short term. Traders should exercise caution and wait for clearer signals before making significant trading decisions.