Technical Analysis of RDWR 2024-05-10
Overview:
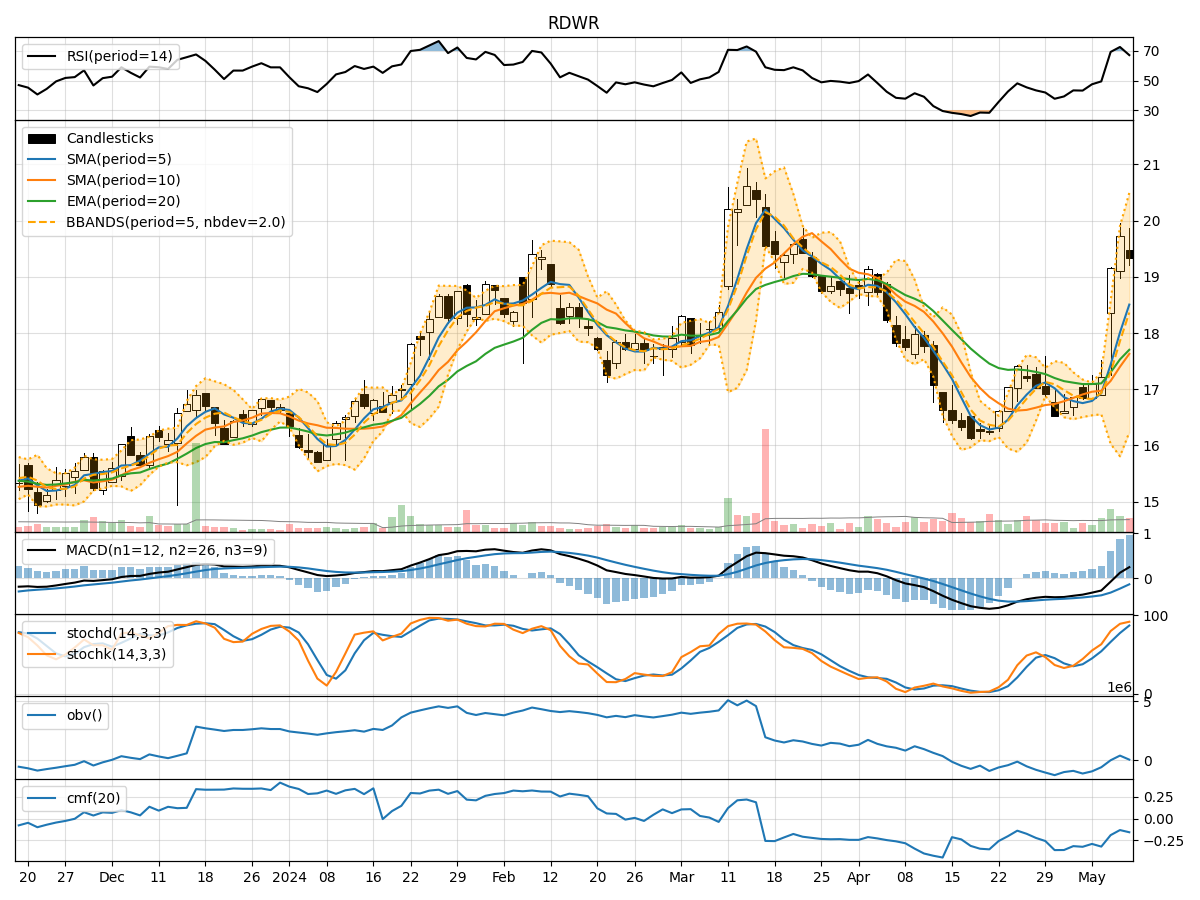
In analyzing the technical indicators for RDWR over the last 5 days, we will delve into the trend, momentum, volatility, and volume indicators to provide a comprehensive outlook on the possible stock price movement in the coming days. By examining these key indicators, we aim to offer valuable insights and predictions for informed decision-making.
Trend Indicators:
- Moving Averages (MA): The 5-day MA has been trending above the closing prices, indicating a short-term bullish trend.
- MACD: The MACD line has been consistently above the signal line, suggesting bullish momentum.
- RSI: The RSI has been fluctuating around the 50 level, indicating a neutral stance in terms of momentum.
Momentum Indicators:
- Stochastic Oscillator: Both %K and %D have been in overbought territory, signaling potential for a pullback.
- Williams %R: The indicator has been in oversold territory, suggesting a possible reversal in the short term.
Volatility Indicators:
- Bollinger Bands: The stock price has been trading within the bands, indicating normal volatility.
- BB% (Bollinger Band %B): The %B has been fluctuating around the midline, suggesting a balanced market sentiment.
Volume Indicators:
- On-Balance Volume (OBV): The OBV has been declining, indicating selling pressure in the market.
- Chaikin Money Flow (CMF): The CMF has been negative, reflecting a lack of buying interest.
Key Observations and Opinions:
- Trend: The trend indicators suggest a bullish bias in the short term.
- Momentum: Momentum indicators show signs of overbought conditions, hinting at a potential correction.
- Volatility: Volatility remains within normal levels, indicating stability in price movements.
- Volume: The declining OBV and negative CMF point towards a bearish sentiment among investors.
Conclusion:
Based on the analysis of the technical indicators, the stock price of RDWR is likely to experience a short-term correction due to overbought conditions indicated by momentum indicators. The overall trend remains bullish, but caution is advised as the stock may consolidate or pull back in the coming days. Traders should monitor key support levels and consider taking profits or implementing risk management strategies.