Technical Analysis of REE 2024-05-10
Overview:
In analyzing the technical indicators for REE over the last 5 days, we will delve into the trend, momentum, volatility, and volume indicators to provide a comprehensive outlook on the possible stock price movement in the coming days. By examining these key indicators, we aim to offer valuable insights and recommendations for potential investors.
Trend Analysis:
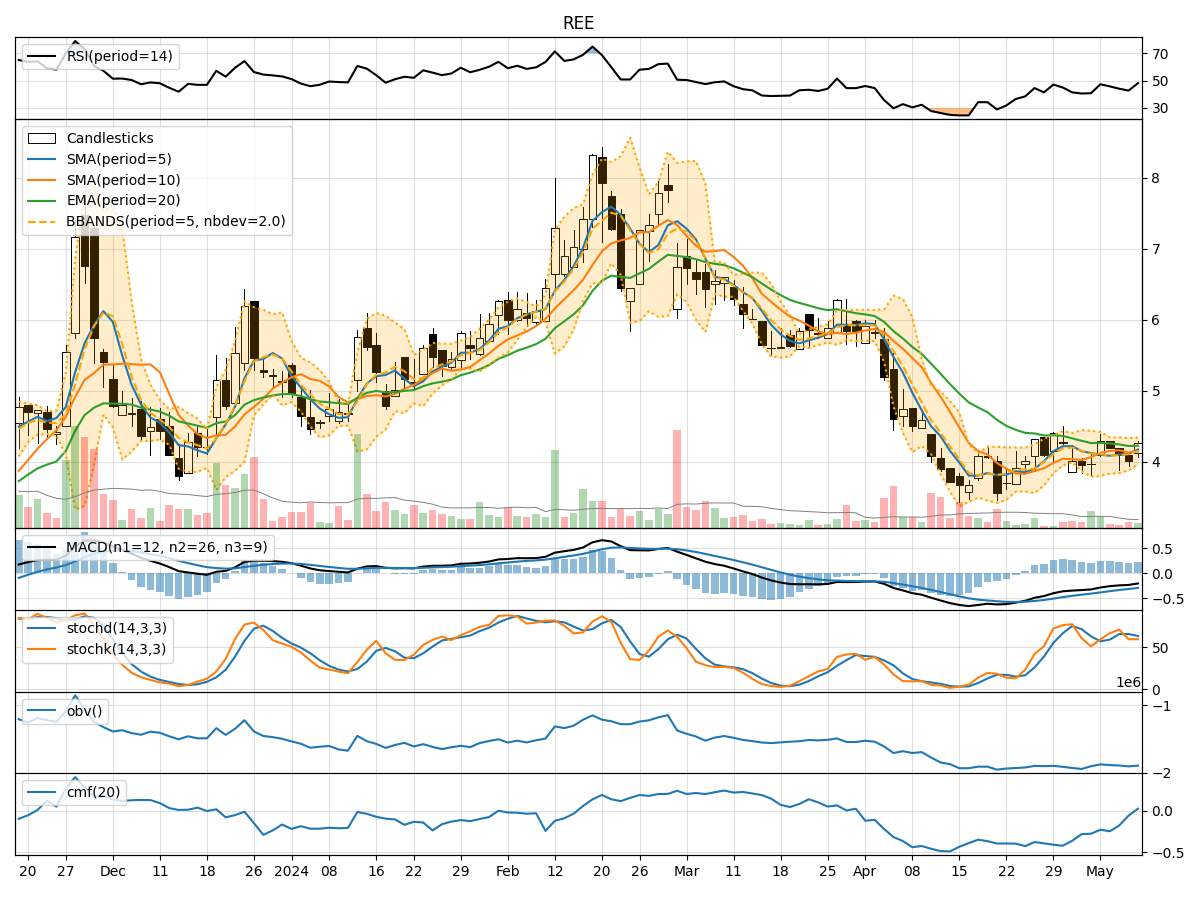
- Moving Averages (MA): The 5-day MA has been fluctuating around the closing prices, indicating short-term price trends. The SMA(10) and EMA(20) show a downward trend, suggesting a bearish sentiment in the medium to long term.
- Moving Average Convergence Divergence (MACD): The MACD line has been consistently negative, indicating a bearish trend. The MACD Histogram is positive but decreasing, signaling a potential reversal.
- Conclusion: The trend indicators point towards a bearish outlook in the short to medium term.
Momentum Analysis:
- Relative Strength Index (RSI): The RSI values have been fluctuating around the midline, indicating indecision in the market. There is no clear overbought or oversold signal.
- Stochastic Oscillator: Both %K and %D values have been fluctuating, showing a lack of strong momentum in either direction.
- Conclusion: The momentum indicators suggest a sideways movement with no clear trend direction.
Volatility Analysis:
- Bollinger Bands (BB): The stock price has been trading within the bands, with the %B indicator hovering around the midline. The bands are narrowing, indicating decreasing volatility.
- Conclusion: Volatility is decreasing, suggesting a consolidation phase in the stock price.
Volume Analysis:
- On-Balance Volume (OBV): The OBV values have been declining, indicating selling pressure in the market.
- Chaikin Money Flow (CMF): The CMF values are negative, suggesting a lack of buying interest.
- Conclusion: Volume indicators point towards a bearish sentiment with more selling pressure.
Overall Conclusion:
Based on the analysis of trend, momentum, volatility, and volume indicators, the next few days' possible stock price movement for REE is likely to be sideways with a bearish bias. The trend indicators signal a bearish outlook, while the momentum indicators suggest a lack of clear direction. Volatility is decreasing, indicating a consolidation phase, and volume indicators point towards more selling pressure.
Recommendation:
Investors should exercise caution and closely monitor the stock price movement. Consider waiting for more clarity in the market direction before making any significant investment decisions. It is advisable to set stop-loss levels to manage risk effectively in the current market environment.