Technical Analysis of REG 2024-05-10
Overview:
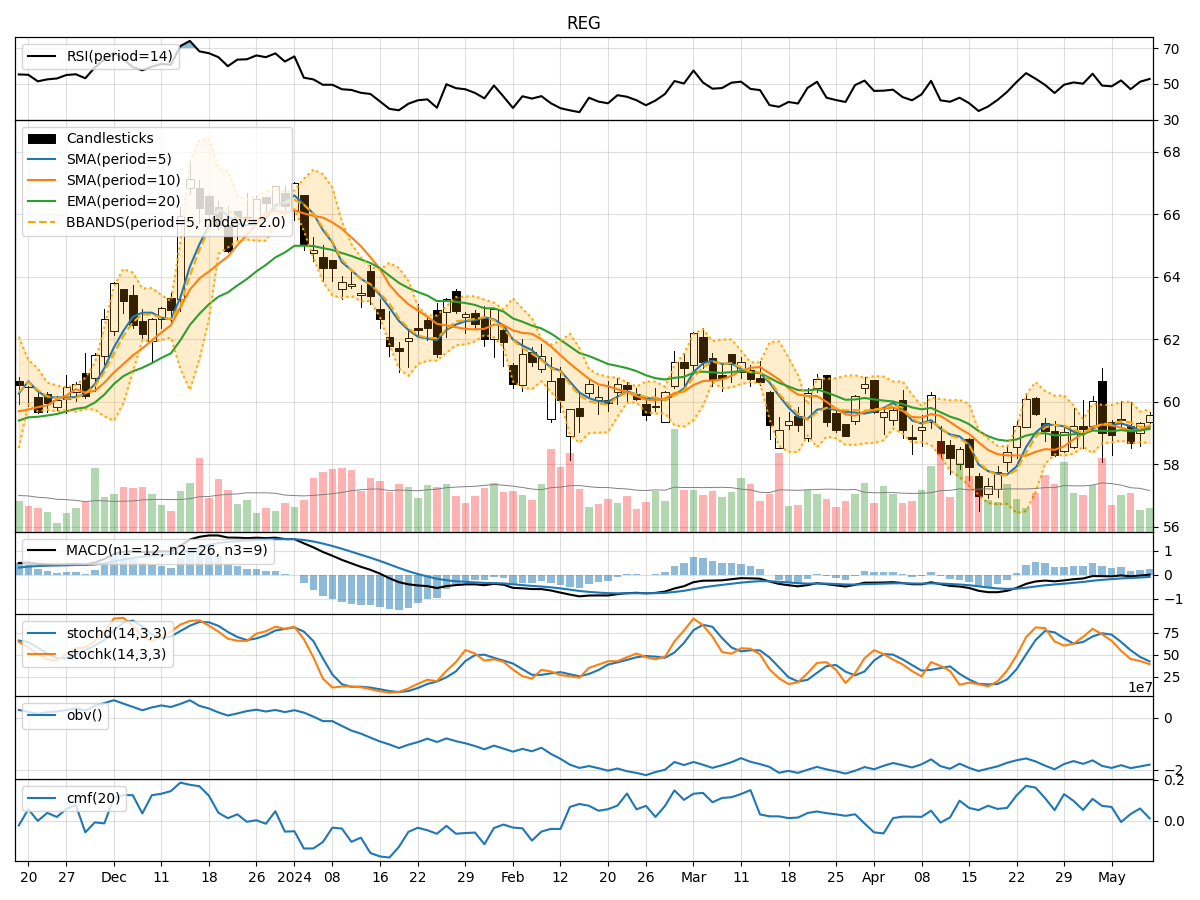
In analyzing the technical indicators for REG stock over the last 5 days, we will delve into the trend, momentum, volatility, and volume indicators to provide a comprehensive outlook on the possible stock price movement in the coming days. By examining these key aspects, we aim to offer valuable insights and predictions for informed decision-making.
Trend Analysis:
- Moving Averages (MA): The 5-day Moving Average (MA) has been fluctuating around the actual stock prices, indicating a relatively stable trend.
- MACD: The Moving Average Convergence Divergence (MACD) has shown mixed signals with the MACD line crossing above and below the signal line, suggesting indecision in the short-term trend.
- EMA: The Exponential Moving Average (EMA) has been slightly increasing, reflecting a potential bullish sentiment in the mid to long term.
Momentum Analysis:
- RSI: The Relative Strength Index (RSI) has been hovering around the neutral zone, indicating a balanced momentum between buying and selling pressure.
- Stochastic Oscillator: Both %K and %D have been declining, suggesting a weakening momentum in the stock price movement.
- Williams %R: The Williams %R is in the oversold territory, indicating a possible reversal or consolidation phase.
Volatility Analysis:
- Bollinger Bands: The Bollinger Bands have been narrowing, indicating decreasing volatility and a potential upcoming breakout or significant price movement.
- Bollinger %B: The %B indicator is relatively neutral, suggesting a balanced volatility level in the stock.
Volume Analysis:
- On-Balance Volume (OBV): The OBV has been fluctuating, indicating mixed buying and selling pressure in the stock.
- Chaikin Money Flow (CMF): The CMF has been positive, suggesting a net inflow of money into the stock over the past 20 days.
Conclusion:
Based on the analysis of the technical indicators, the stock of REG is currently exhibiting mixed signals across different aspects. The trend indicators show a slightly bullish sentiment in the mid-term, while momentum indicators suggest a weakening momentum in the short term. Volatility is decreasing, indicating a potential consolidation phase, and volume indicators reflect mixed buying and selling pressure.
Overall Assessment:
- Short-Term Outlook: The stock may experience some consolidation or a slight pullback in the short term due to weakening momentum and narrowing volatility.
- Mid-Term Outlook: The mid-term trend appears slightly bullish, supported by the EMA and moving averages.
- Key Recommendation: Exercise caution and closely monitor the stock's price action for potential entry or exit points.
Final Verdict:
Considering the mixed signals and the current market dynamics, the next few days for REG stock are likely to see sideways movement with a slight bearish bias. It is crucial for investors to stay vigilant and adapt their strategies accordingly to navigate through the upcoming market conditions.