Technical Analysis of RFAC 2024-05-10
Overview:
In analyzing the technical indicators for RFAC over the last 5 days, we will delve into the trend, momentum, volatility, and volume indicators to provide a comprehensive outlook on the possible stock price movement in the coming days. By examining these key aspects, we aim to offer valuable insights and predictions for potential investors.
Trend Indicators:
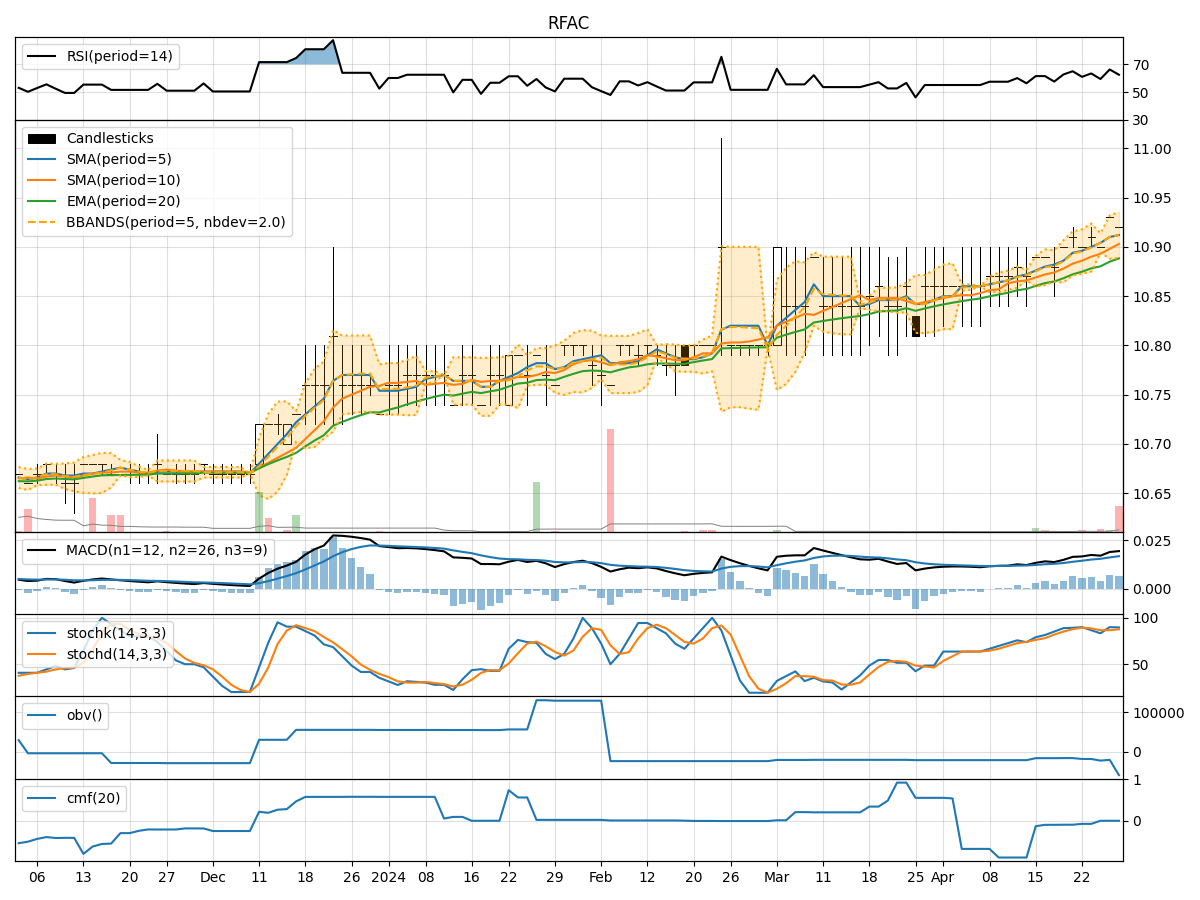
- Moving Averages (MA): The 5-day MA has been relatively stable around the closing prices, indicating a consistent trend.
- MACD: The MACD line has shown slight fluctuations but has generally remained positive, suggesting a bullish momentum.
- RSI: The RSI values have fluctuated within the neutral range, indicating a lack of strong directional bias.
Key Observation: The trend indicators suggest a neutral to slightly bullish sentiment in the stock price movement.
Momentum Indicators:
- Stochastic Oscillator: The Stochastic Oscillator values have fluctuated, showing mixed signals without a clear trend direction.
- Williams %R (WillR): The Williams %R values have been oscillating, indicating indecision in the market sentiment.
Key Observation: The momentum indicators reflect a lack of strong momentum or trend direction in the stock price.
Volatility Indicators:
- Bollinger Bands (BB): The Bollinger Bands have shown narrowing bands, suggesting decreasing volatility.
- BB% (BB Percentage): The BB% values have fluctuated but have generally remained within a moderate range.
Key Observation: Volatility has been decreasing, indicating a potential period of consolidation or a calm market environment.
Volume Indicators:
- On-Balance Volume (OBV): The OBV values have remained constant, indicating a lack of significant volume changes.
- Chaikin Money Flow (CMF): The CMF values have been negative, suggesting selling pressure in the market.
Key Observation: Volume indicators point towards a neutral volume flow with a slight inclination towards selling pressure.
Conclusion:
Based on the analysis of the technical indicators, the stock of RFAC is currently exhibiting a sideways trend with neutral to slightly bullish sentiment. The lack of strong momentum, coupled with decreasing volatility and neutral volume flow, indicates a potential period of consolidation in the coming days. Investors should exercise caution and closely monitor any breakout or reversal signals in the technical indicators to make informed trading decisions.
Recommendation:
Given the current market dynamics, it is advisable for investors to wait for clearer signals or confirmation of a trend before making significant trading decisions. Monitoring key levels and potential breakout points can help in identifying the next directional move in RFAC stock. It is essential to combine technical analysis with fundamental research to gain a holistic view of the stock's performance and make well-informed investment choices.