Technical Analysis of RGEN 2024-05-10
Overview:
In analyzing the technical indicators for RGEN over the last 5 days, we will delve into the trend, momentum, volatility, and volume indicators to provide a comprehensive outlook on the possible stock price movement. By examining these key indicators, we aim to offer valuable insights and predictions for the upcoming days.
Trend Analysis:
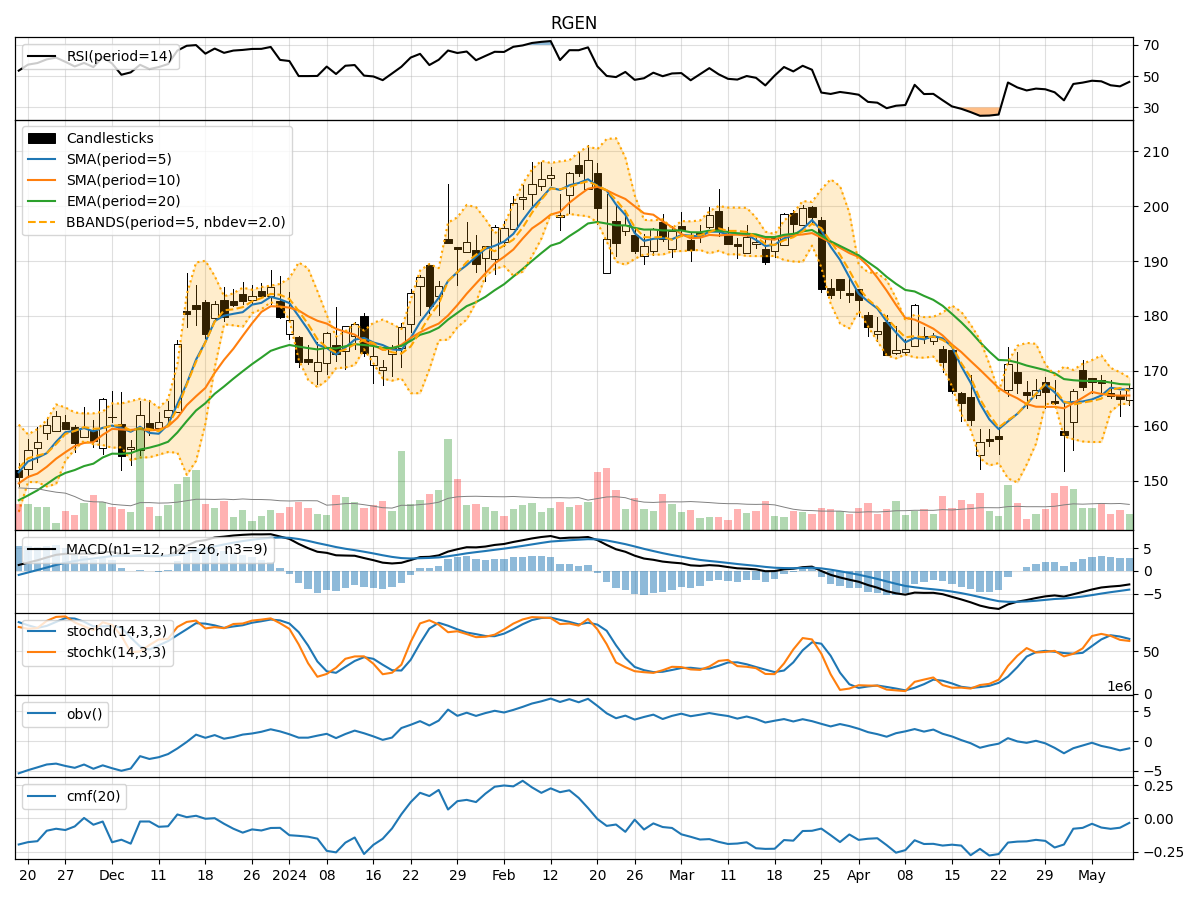
- Moving Averages (MA): The 5-day Moving Average (MA) has been fluctuating around the Simple Moving Average (SMA) and Exponential Moving Average (EMA) values, indicating a lack of clear trend direction.
- MACD: The Moving Average Convergence Divergence (MACD) has been negative, suggesting a bearish momentum in the short term.
- Conclusion: The trend indicators point towards a bearish sentiment in the short term.
Momentum Analysis:
- RSI: The Relative Strength Index (RSI) has been hovering around the mid-range, indicating a neutral momentum.
- Stochastic Oscillator: Both %K and %D values have been declining, signaling a weakening momentum.
- Conclusion: The momentum indicators suggest a neutral to bearish outlook for the stock.
Volatility Analysis:
- Bollinger Bands (BB): The Bollinger Bands have been narrowing, indicating decreasing volatility in the stock price.
- Conclusion: The volatility indicators imply a low volatility environment currently.
Volume Analysis:
- On-Balance Volume (OBV): The OBV has been on a downtrend, reflecting selling pressure in the stock.
- Chaikin Money Flow (CMF): The CMF has been negative, indicating a lack of buying interest.
- Conclusion: The volume indicators point towards bearish sentiment in terms of volume flow.
Key Observations:
- The trend indicators suggest a bearish sentiment in the short term, supported by the negative MACD.
- Momentum indicators indicate a neutral to bearish momentum, with the RSI and Stochastic Oscillator showing weakening signals.
- Volatility is low, as depicted by the narrowing Bollinger Bands, which may lead to a potential breakout in the future.
- Volume indicators reflect a bearish volume flow, with OBV and CMF signaling selling pressure and lack of buying interest.
Conclusion:
Based on the analysis of trend, momentum, volatility, and volume indicators, the overall outlook for RGEN in the next few days appears to be bearish. Traders and investors should exercise caution and consider potential downside risks in their decision-making process. It is advisable to closely monitor key support levels and wait for clearer signals before considering any bullish positions.