Technical Analysis of RLYB 2024-05-31
Overview:
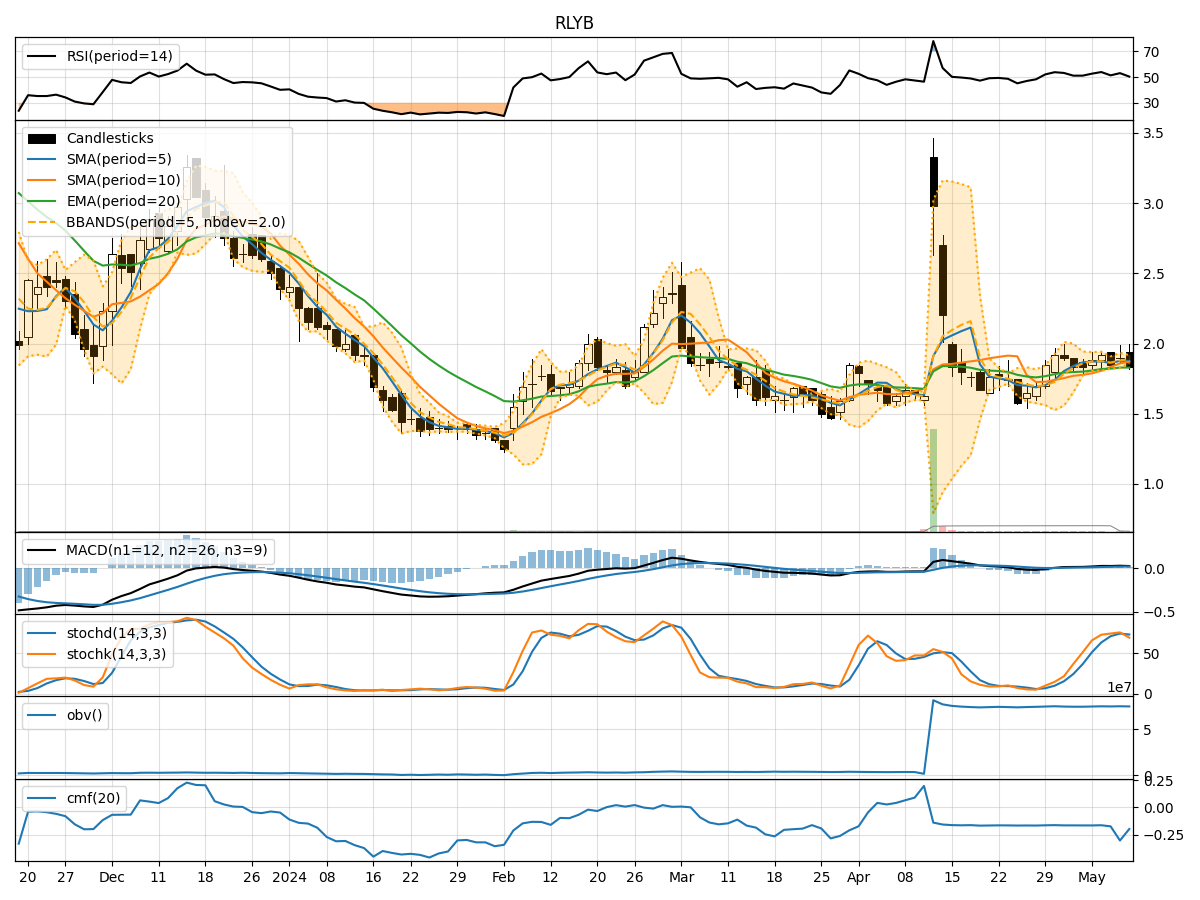
In analyzing the technical indicators for RLYB over the last 5 days, we will delve into the trend, momentum, volatility, and volume indicators to provide a comprehensive outlook on the possible stock price movement in the coming days. By examining these key aspects, we aim to offer valuable insights and predictions for potential investors.
Trend Indicators:
- Moving Averages (MA): The 5-day MA has been declining, indicating a short-term bearish trend.
- MACD: The MACD line has been consistently negative, suggesting a bearish momentum.
- EMA: The EMA has been decreasing, aligning with the bearish sentiment in the short term.
Momentum Indicators:
- RSI: The RSI has shown mixed signals but has been trending upwards, indicating a potential reversal in momentum.
- Stochastic Oscillator: Both %K and %D have been rising, signaling a strengthening momentum.
- Williams %R: The indicator has been improving, moving away from oversold conditions.
Volatility Indicators:
- Bollinger Bands (BB): The bands have been narrowing, indicating decreasing volatility.
- BB Percentage (BBP): The percentage has been fluctuating but is currently at a moderate level.
Volume Indicators:
- On-Balance Volume (OBV): The OBV has been relatively stable, suggesting a neutral volume trend.
- Chaikin Money Flow (CMF): The CMF has been negative, indicating a bearish money flow.
Key Observations and Opinions:
- Trend: The trend indicators point towards a bearish sentiment in the short term.
- Momentum: Momentum indicators show a potential reversal in momentum towards a bullish direction.
- Volatility: Volatility has been decreasing, indicating a possible period of consolidation.
- Volume: Volume indicators suggest a neutral volume trend with a bearish money flow.
Conclusion:
Based on the analysis of the technical indicators, the next few days for RLYB could see mixed price movements with a potential for a bullish reversal in momentum despite the short-term bearish trend. The decreasing volatility and neutral volume trend may lead to a period of sideways consolidation before a clearer trend emerges. Investors should closely monitor key levels and wait for confirmation of a new trend direction before making significant trading decisions.