Technical Analysis of RMCO 2024-05-31
Overview:
In analyzing the technical indicators for RMCO over the last 5 days, we will delve into the trend, momentum, volatility, and volume indicators to provide a comprehensive outlook on the possible stock price movement in the coming days. By examining these key aspects, we aim to offer valuable insights and recommendations for potential investors.
Trend Analysis:
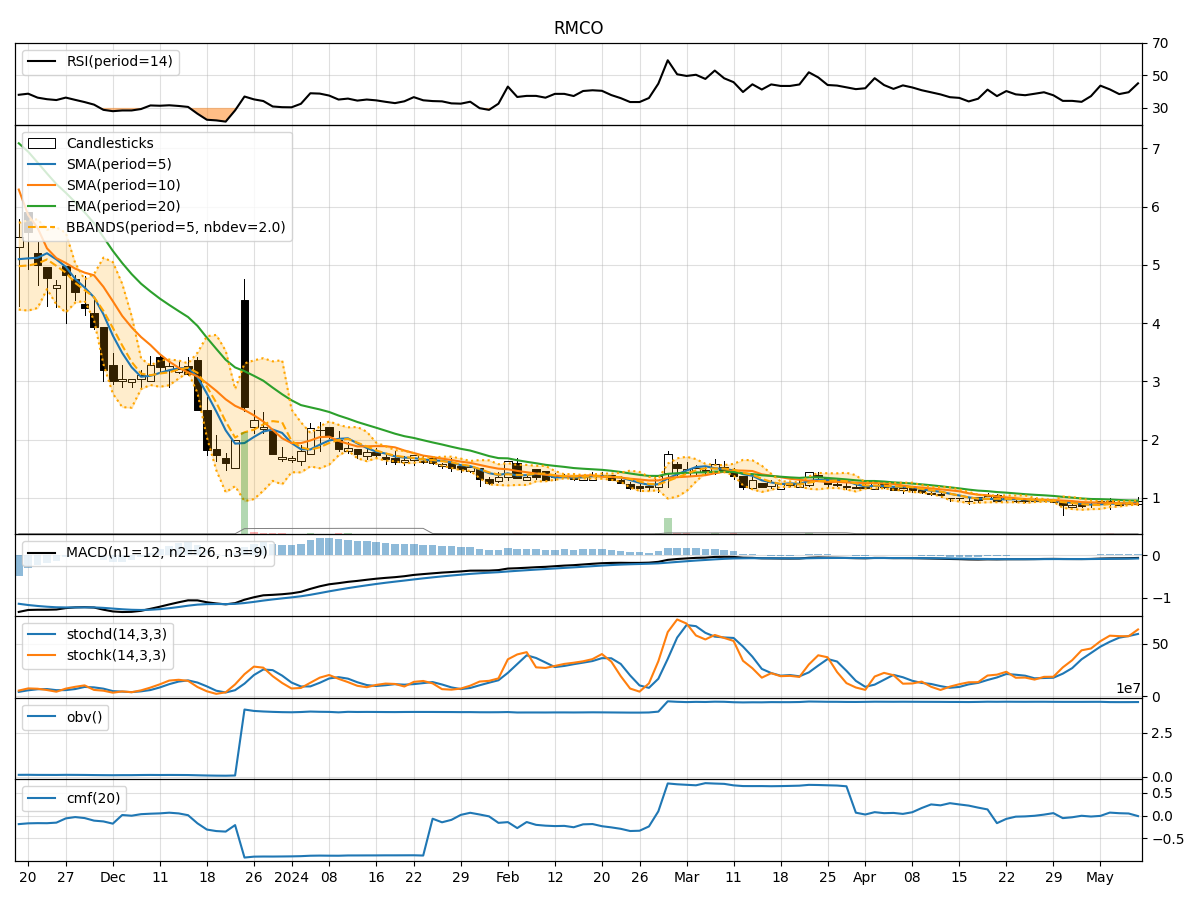
- Moving Averages (MA): The 5-day Moving Average (MA) has been consistently rising, indicating an upward trend in the stock price.
- MACD: The MACD line has been positive and increasing, suggesting bullish momentum in the stock.
- EMA: The Exponential Moving Average (EMA) has been trending upwards, supporting the bullish sentiment in the stock.
Key Observation: The trend indicators point towards a bullish outlook for RMCO.
Momentum Analysis:
- RSI: The Relative Strength Index (RSI) has been fluctuating but remains in the neutral zone, indicating neither overbought nor oversold conditions.
- Stochastic Oscillator: Both %K and %D have been fluctuating but are not in extreme territories, suggesting a balanced momentum.
- Williams %R: The Williams %R is also hovering around the midpoint, indicating a neutral momentum.
Key Observation: The momentum indicators suggest a neutral stance for RMCO.
Volatility Analysis:
- Bollinger Bands: The Bollinger Bands have been narrowing, indicating decreasing volatility in the stock price.
- Bollinger %B: The %B indicator has been fluctuating within a tighter range, reflecting reduced volatility.
- Average True Range (ATR): The ATR has been decreasing, further confirming the diminishing volatility in the stock.
Key Observation: The volatility indicators signal a reduction in volatility for RMCO.
Volume Analysis:
- On-Balance Volume (OBV): The OBV has been relatively stable, suggesting a balanced buying and selling pressure.
- Chaikin Money Flow (CMF): The CMF has been positive but not significantly high, indicating moderate buying pressure.
Key Observation: The volume indicators imply a balanced volume activity for RMCO.
Conclusion:
Based on the analysis of trend, momentum, volatility, and volume indicators, the overall outlook for RMCO in the next few days appears to be bullish with reduced volatility. While momentum remains neutral, the trend indicators strongly support a potential upward movement in the stock price. Investors may consider RMCO for a potential uptrend, keeping a close watch on momentum indicators for any shifts in market sentiment.