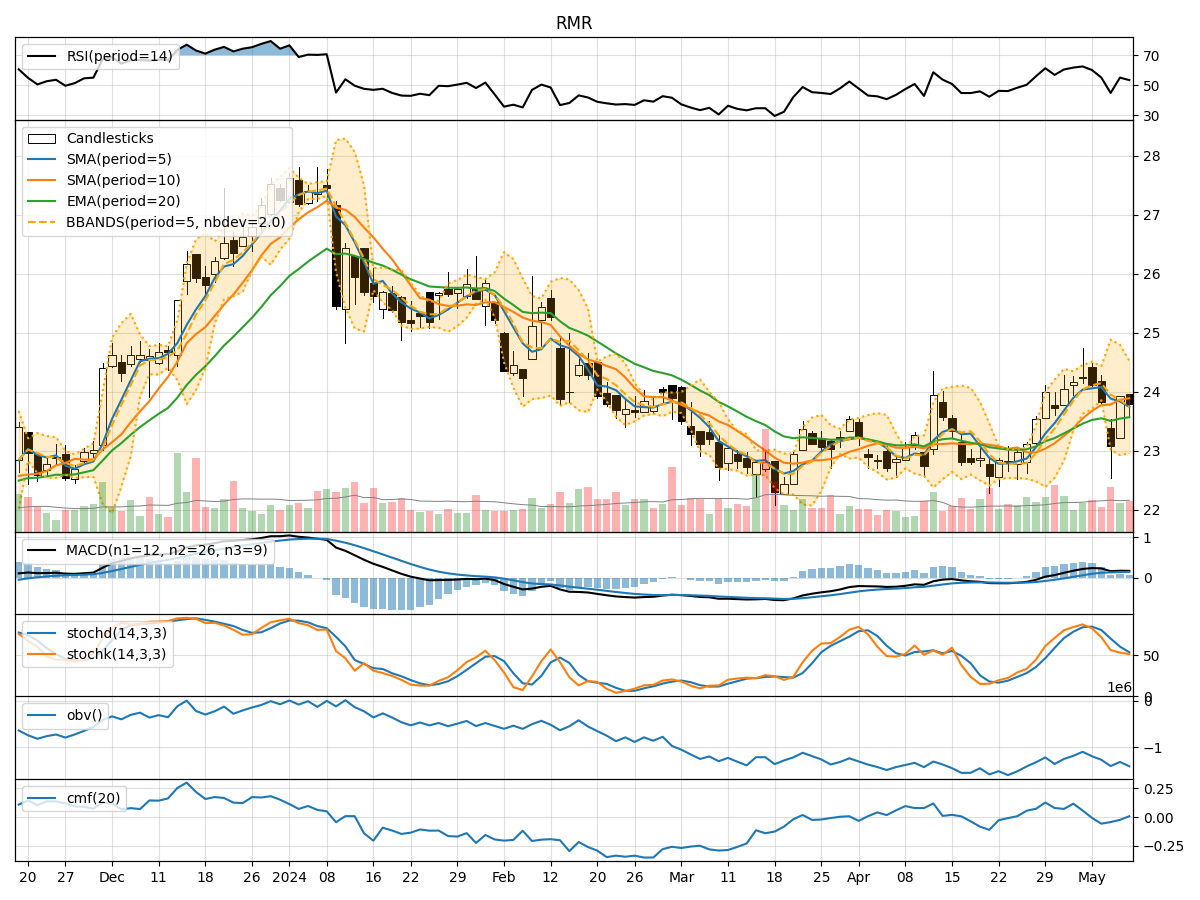
Technical Analysis of RMR 2024-05-31
Overview:
In analyzing the technical indicators for RMR stock over the last 5 days, we will delve into the trend, momentum, volatility, and volume indicators to provide a comprehensive outlook on the possible future stock price movement. By examining these key indicators, we aim to offer valuable insights and predictions for the upcoming trading days.
Trend Analysis:
- Moving Averages (MA): The 5-day Moving Average (MA) has been consistently below the Simple Moving Average (SMA) and Exponential Moving Average (EMA) over the past 5 days, indicating a downward trend in the stock price.
- MACD: The Moving Average Convergence Divergence (MACD) has been negative, with the MACD line below the signal line, suggesting bearish momentum in the stock.
Momentum Analysis:
- RSI: The Relative Strength Index (RSI) has been below 50, indicating a bearish momentum in the stock.
- Stochastic Oscillator: Both %K and %D have been below 20, signaling an oversold condition in the stock.
Volatility Analysis:
- Bollinger Bands (BB): The stock price has been trading below the lower Bollinger Band, indicating potential oversold conditions.
Volume Analysis:
- On-Balance Volume (OBV): The OBV has been consistently negative, suggesting selling pressure in the stock.
- Chaikin Money Flow (CMF): The CMF has been negative, indicating a lack of buying interest in the stock.
Key Observations:
- The stock is currently in a downtrend based on moving averages and MACD.
- Momentum indicators like RSI and Stochastic Oscillator suggest bearish momentum.
- Volatility indicators show the stock is potentially oversold based on Bollinger Bands.
- Volume indicators reflect selling pressure and a lack of buying interest in the stock.
Conclusion:
Based on the analysis of the technical indicators, the next few days' possible stock price movement for RMR is likely to be downward. The stock is expected to continue its bearish trend, with potential oversold conditions and selling pressure persisting. Traders and investors should exercise caution and consider waiting for signs of a reversal before considering any long positions.