Technical Analysis of ROIV 2024-05-10
Overview:
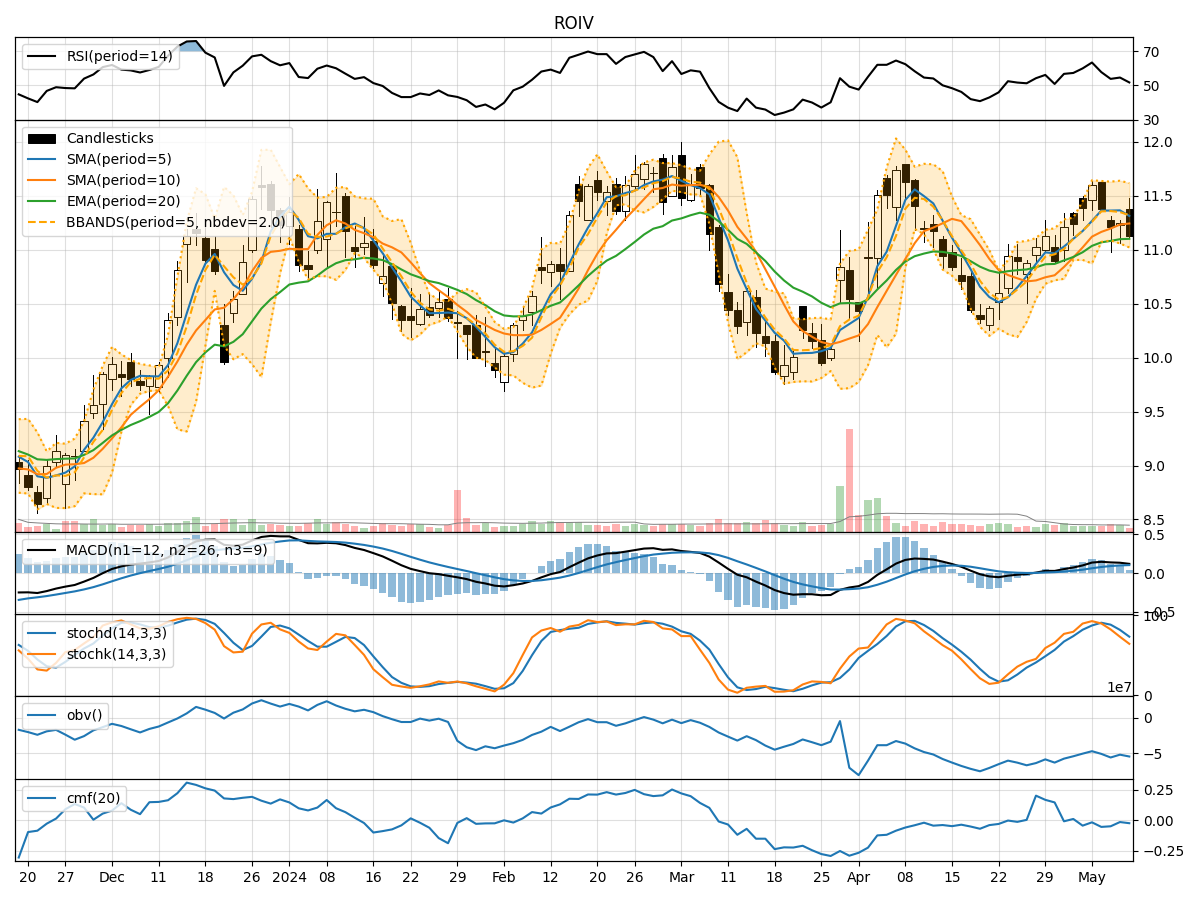
In analyzing the technical indicators for ROIV over the last 5 days, we will delve into the trend, momentum, volatility, and volume indicators to provide a comprehensive assessment of the stock's potential price movement. By examining these key factors, we aim to offer valuable insights and predictions for the next few days.
Trend Analysis:
- Moving Averages (MA): The 5-day Moving Average (MA) has been fluctuating around the closing prices, indicating a lack of clear trend direction.
- MACD and Signal Line: The MACD line has been hovering around the signal line, suggesting a neutral momentum in the short term.
- Relative Strength Index (RSI): The RSI has been oscillating around the 50 level, indicating a balanced momentum between buying and selling pressure.
Key Observation: The trend indicators suggest a lack of strong directional bias in the stock's price movement.
Momentum Analysis:
- Stochastic Oscillator: The Stochastic Oscillator has been gradually declining, indicating a potential bearish momentum.
- Williams %R (WillR): The Williams %R has been in oversold territory, suggesting a possible reversal in the short term.
Key Observation: Momentum indicators point towards a bearish sentiment in the stock's momentum.
Volatility Analysis:
- Bollinger Bands (BB): The Bollinger Bands have been narrowing, indicating decreasing volatility in the stock's price movement.
- Bollinger Band %B (BBP): The %B indicator has been relatively low, suggesting a potential consolidation phase.
Key Observation: Volatility indicators signal a period of consolidation and reduced price fluctuations.
Volume Analysis:
- On-Balance Volume (OBV): The OBV has been declining, indicating a decrease in buying volume compared to selling volume.
- Chaikin Money Flow (CMF): The CMF has been negative, suggesting a lack of strong buying pressure in the stock.
Key Observation: Volume indicators reflect a weakening buying interest and potential selling pressure in the stock.
Conclusion:
Based on the analysis of trend, momentum, volatility, and volume indicators, the overall outlook for ROIV in the next few days appears to be bearish. The lack of a clear trend, coupled with bearish momentum signals and decreasing buying interest, indicates a potential downward movement in the stock price. Additionally, the consolidation phase and reduced volatility suggest a period of stability or minor price fluctuations.
Key Conclusion: The next few days are likely to see a downward movement in ROIV's stock price, with a potential for consolidation in the short term. Investors should exercise caution and consider risk management strategies in their trading decisions.