Technical Analysis of ROP 2024-05-10
Overview:
In analyzing the technical indicators for ROP over the last 5 days, we will delve into the trend, momentum, volatility, and volume indicators to provide a comprehensive outlook on the possible stock price movement in the coming days.
Trend Indicators:
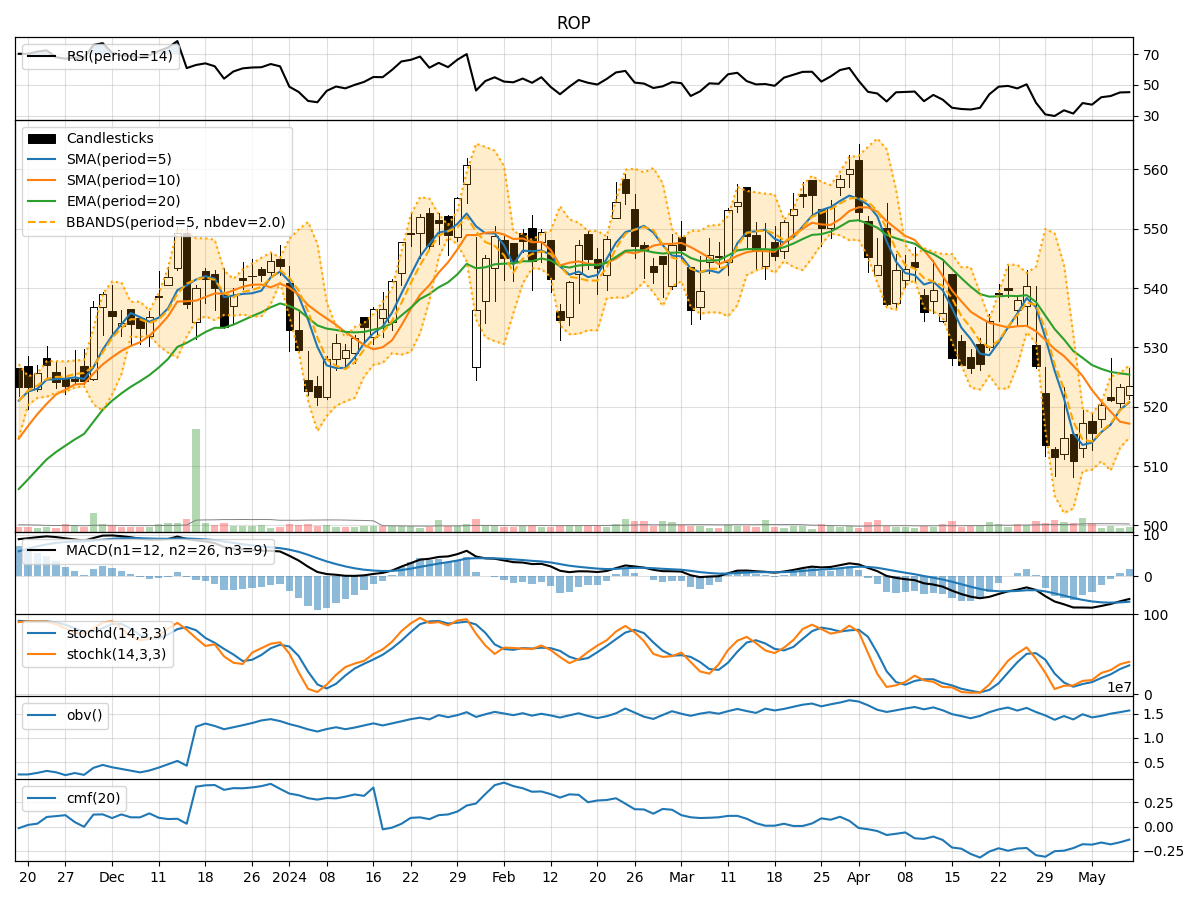
- Moving Averages (MA): The 5-day MA has been fluctuating around the 520 level, indicating a short-term consolidation phase.
- MACD: The MACD has been negative but showing signs of convergence towards the signal line, suggesting a potential reversal in the near future.
Momentum Indicators:
- RSI: The RSI has been gradually increasing, indicating strengthening momentum.
- Stochastic Oscillator: Both %K and %D have been rising, signaling increasing buying pressure.
- Williams %R: The indicator has been improving but remains in oversold territory, suggesting a potential reversal.
Volatility Indicators:
- Bollinger Bands: The bands have been narrowing, indicating decreasing volatility and a possible breakout soon.
Volume Indicators:
- On-Balance Volume (OBV): The OBV has been steadily increasing, showing accumulation by investors.
- Chaikin Money Flow (CMF): The CMF has been negative, indicating selling pressure in the short term.
Key Observations:
- The stock is currently in a consolidation phase with mixed signals from trend and momentum indicators.
- Volatility is decreasing, suggesting a potential breakout or significant price movement ahead.
- Accumulation is evident from the OBV, but selling pressure is reflected in the CMF.
Conclusion:
Based on the analysis of the technical indicators, the next few days may see sideways movement with a potential bullish bias. The convergence of the MACD, increasing RSI, and rising Stochastic indicators point towards a possible upward movement. However, the stock may face resistance near the recent highs. Traders should watch for a breakout above this level to confirm a bullish trend. Consider a cautious bullish stance with close monitoring of key resistance levels for potential entry or exit points.