Technical Analysis of RPRX 2024-05-10
Overview:
In analyzing the technical indicators for RPRX over the last 5 days, we will delve into the trend, momentum, volatility, and volume indicators to provide a comprehensive outlook on the possible stock price movement in the coming days. By examining these key aspects, we aim to offer valuable insights and predictions for potential investors.
Trend Analysis:
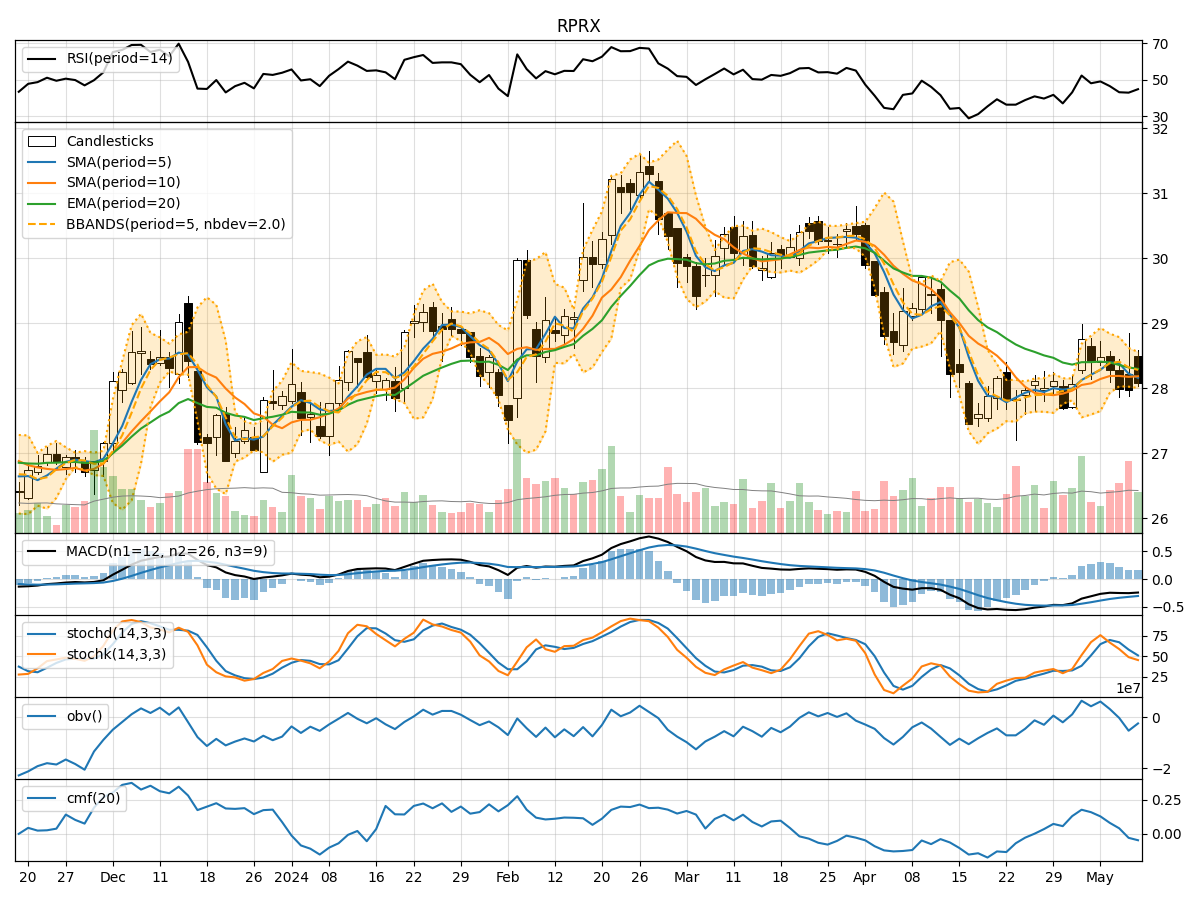
- Moving Averages (MA): The 5-day Moving Average (MA) has been fluctuating around the closing prices, indicating a lack of clear trend direction.
- MACD: The Moving Average Convergence Divergence (MACD) has been negative, suggesting a bearish momentum in the short term.
- EMA: The Exponential Moving Average (EMA) has been declining, further supporting the bearish sentiment in the stock.
Key Observation: The trend indicators point towards a bearish outlook for RPRX in the short term.
Momentum Analysis:
- RSI: The Relative Strength Index (RSI) has been decreasing, indicating weakening momentum.
- Stochastic Oscillator: Both %K and %D have been declining, signaling a loss in bullish momentum.
- Williams %R: The Williams %R is hovering around oversold levels, suggesting a potential reversal.
Key Observation: Momentum indicators reflect a bearish sentiment with a possibility of a reversal in the near future.
Volatility Analysis:
- Bollinger Bands: The Bollinger Bands have been narrowing, indicating decreasing volatility.
- Bollinger %B: The %B indicator is below 0.5, suggesting a potential oversold condition.
- Average True Range (ATR): ATR has been decreasing, indicating lower volatility levels.
Key Observation: Volatility indicators signal a decrease in volatility and a possible consolidation phase.
Volume Analysis:
- On-Balance Volume (OBV): OBV has been declining, indicating selling pressure in the stock.
- Chaikin Money Flow (CMF): CMF has been negative, suggesting outflow of money from the stock.
Key Observation: Volume indicators point towards bearish sentiment with higher selling pressure.
Conclusion:
Based on the analysis of trend, momentum, volatility, and volume indicators, the overall outlook for RPRX in the next few days is bearish. The trend indicators, momentum oscillators, and volume indicators all align in signaling a potential downward movement in the stock price. However, the decreasing volatility may lead to a consolidation phase before any significant price action. Investors should exercise caution and consider waiting for a clearer trend reversal signal before making any trading decisions.
Key Conclusion:
The next few days for RPRX are likely to see downward price movement with a possibility of consolidation in the short term. Investors are advised to monitor the trend reversal signals closely before considering any buying opportunities.