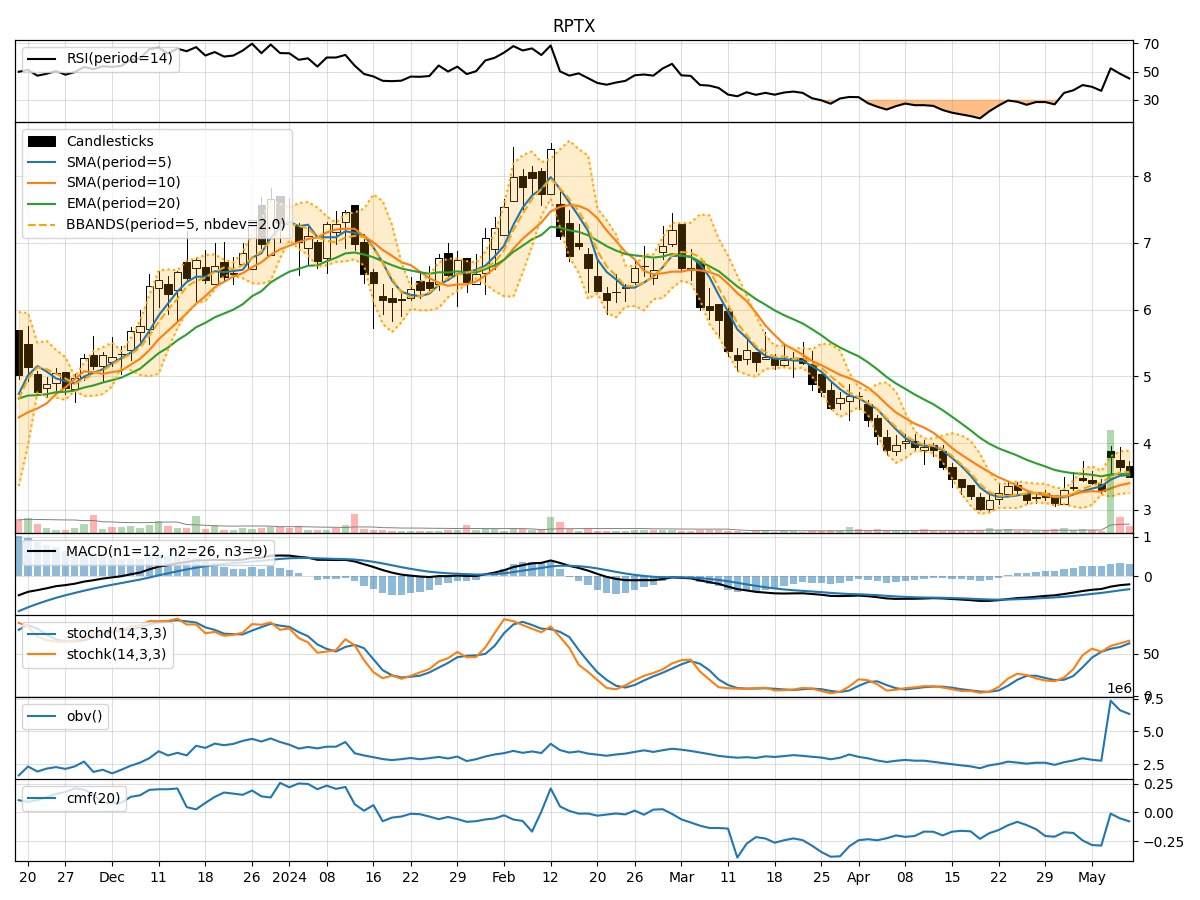
Technical Analysis of RPTX 2024-05-10
Overview:
In analyzing the technical indicators for RPTX over the last 5 days, we will delve into the trend, momentum, volatility, and volume indicators to provide a comprehensive outlook on the possible stock price movement. By examining these key factors, we aim to offer valuable insights and predictions for the upcoming days.
Trend Analysis:
- Moving Averages (MA): The 5-day Moving Average (MA) has been fluctuating around the closing prices, indicating short-term price trends. The Simple Moving Average (SMA) and Exponential Moving Average (EMA) show a slight divergence, suggesting potential price volatility.
- MACD: The Moving Average Convergence Divergence (MACD) has been negative but with a slight upward trend, indicating a possible reversal in the short term.
- Conclusion: The trend indicators suggest a neutral to slightly bullish outlook for RPTX in the near future.
Momentum Analysis:
- RSI: The Relative Strength Index (RSI) has been fluctuating around the mid-level, indicating a balanced momentum between buying and selling pressure.
- Stochastic Oscillator: Both %K and %D have been in the overbought territory, suggesting a potential reversal or consolidation phase.
- Conclusion: The momentum indicators point towards a neutral to slightly bearish sentiment for RPTX in the upcoming days.
Volatility Analysis:
- Bollinger Bands (BB): The Bollinger Bands have shown a widening pattern, indicating increased price volatility.
- Conclusion: The volatility indicators suggest a high volatility environment for RPTX, which could lead to significant price swings in the short term.
Volume Analysis:
- On-Balance Volume (OBV): The OBV has shown mixed signals, with fluctuations in volume accumulation/distribution.
- Chaikin Money Flow (CMF): The CMF has been negative, indicating selling pressure in the market.
- Conclusion: The volume indicators reflect a mixed sentiment with no clear direction for RPTX's price movement.
Overall Conclusion:
Based on the analysis of trend, momentum, volatility, and volume indicators, the overall outlook for RPTX in the next few days is as follows: - Trend: Neutral to slightly bullish - Momentum: Neutral to slightly bearish - Volatility: High volatility - Volume: Mixed sentiment
Final Recommendation:
Considering the mixed signals from the technical indicators, it is advisable to exercise caution when trading RPTX in the upcoming days. Traders should closely monitor key levels and wait for clearer signals before taking significant positions. The stock is likely to experience increased volatility with a potential for both upward and downward movements. It is crucial to have a well-defined risk management strategy in place to navigate the market uncertainties effectively.