Technical Analysis of RSVR 2024-05-10
Overview:
In analyzing the technical indicators for RSVR stock over the last 5 days, we will delve into the trend, momentum, volatility, and volume indicators to provide a comprehensive outlook on the possible stock price movement in the coming days. By examining these key indicators, we aim to offer valuable insights and predictions to guide investment decisions.
Trend Indicators:
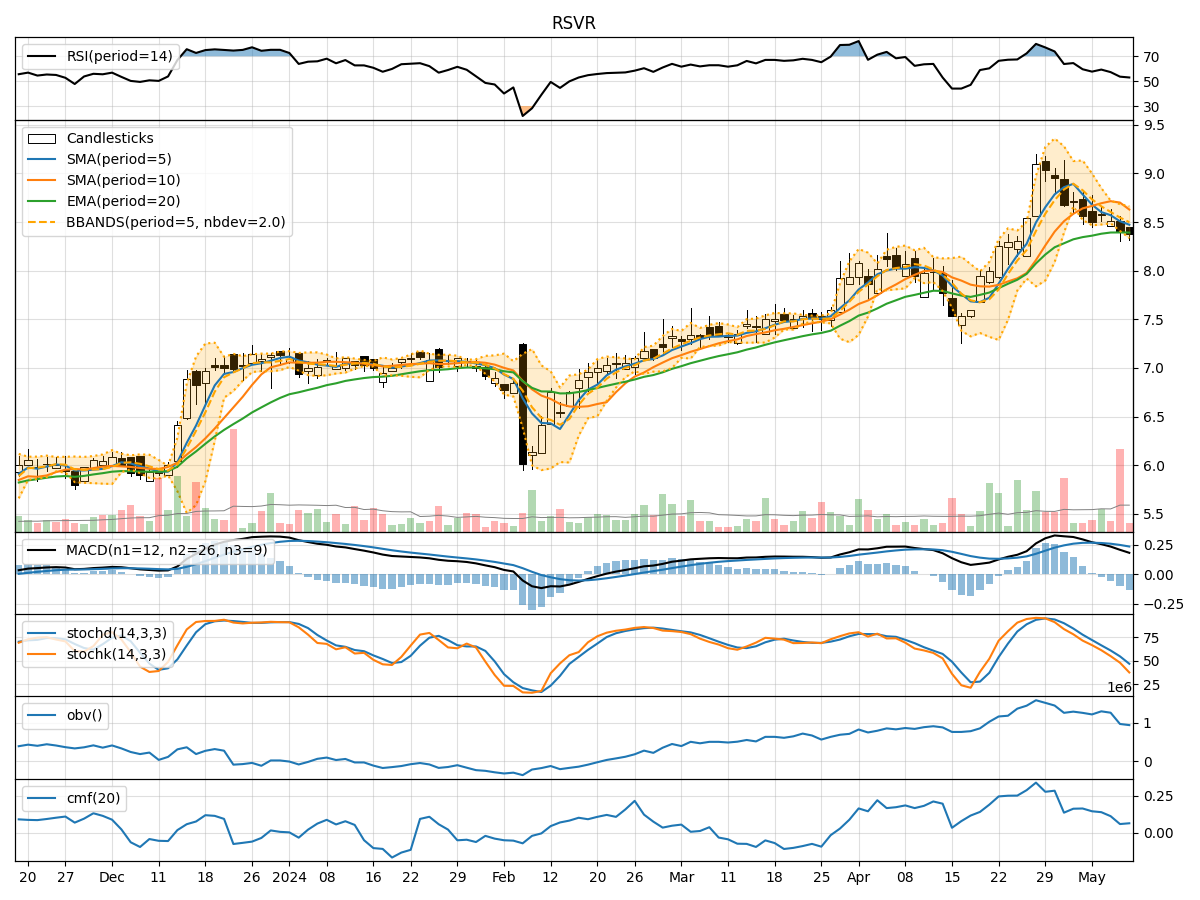
- Moving Averages (MA): The 5-day MA has been gradually decreasing, indicating a short-term downtrend in the stock price.
- MACD: The MACD line has been positive, but the MACD Histogram has been decreasing, suggesting a potential reversal in the bullish momentum.
Momentum Indicators:
- RSI: The RSI has been declining, indicating weakening momentum in the stock price.
- Stochastic Oscillator: Both %K and %D have been decreasing, signaling a bearish momentum.
Volatility Indicators:
- Bollinger Bands (BB): The stock price has been trading within the bands, with the bands narrowing, indicating decreasing volatility.
Volume Indicators:
- On-Balance Volume (OBV): The OBV has been declining, suggesting selling pressure in the stock.
- Chaikin Money Flow (CMF): The CMF has also been decreasing, indicating a decrease in buying pressure.
Key Observations and Opinions:
- Trend: The stock is currently in a short-term downtrend based on the moving averages and MACD analysis.
- Momentum: Momentum indicators like RSI and Stochastic Oscillator are showing bearish signals, indicating a potential further downside.
- Volatility: Volatility has been decreasing, which could lead to a period of consolidation or a potential breakout in the near future.
- Volume: The declining OBV and CMF suggest a lack of strong buying interest in the stock.
Conclusion:
Based on the analysis of the technical indicators, the next few days' possible stock price movement for RSVR is likely to be downward. The trend is bearish, momentum indicators are showing weakness, and volume indicators suggest selling pressure. Traders and investors should exercise caution and consider waiting for more favorable conditions before entering a long position.