Technical Analysis of RUSHA 2024-05-31
Overview:
In analyzing the technical indicators for RUSHA over the last 5 days, we will delve into the trend, momentum, volatility, and volume indicators to provide a comprehensive outlook on the possible stock price movement in the coming days. By examining these key indicators, we aim to offer valuable insights and recommendations for potential investors.
Trend Analysis:
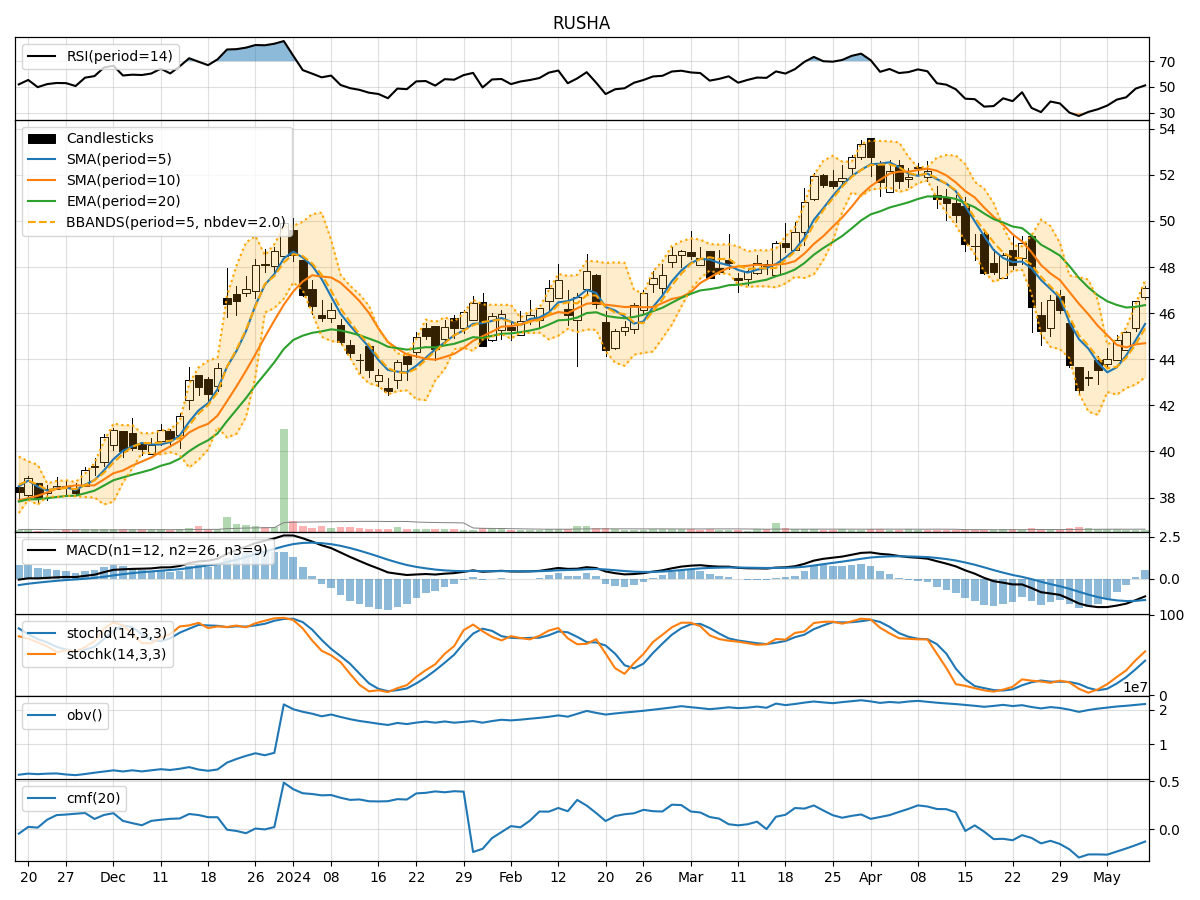
- Moving Averages (MA): The 5-day MA has been fluctuating around the closing prices, indicating short-term price trends. The SMA(10) and EMA(20) show a downward trend, suggesting a bearish sentiment in the medium to long term.
- MACD: The MACD line has been consistently below the signal line, indicating a bearish trend in the stock price.
- Conclusion: The trend indicators suggest a bearish outlook for RUSHA in the near future.
Momentum Analysis:
- RSI: The RSI has been fluctuating but remains below the overbought threshold of 70, indicating a neutral to slightly bearish momentum.
- Stochastic Oscillator: Both %K and %D have been trending downwards, suggesting a weakening momentum.
- Conclusion: The momentum indicators point towards a neutral to bearish sentiment for RUSHA.
Volatility Analysis:
- Bollinger Bands (BB): The stock price has been trading within the bands, with the %B indicator hovering around the midline, indicating moderate volatility.
- Conclusion: Volatility indicators suggest a stable price movement for RUSHA in the upcoming days.
Volume Analysis:
- On-Balance Volume (OBV): The OBV has shown mixed signals, with fluctuations in volume accumulation.
- Chaikin Money Flow (CMF): The CMF has been slightly positive, indicating some buying pressure.
- Conclusion: Volume indicators provide a mixed outlook for RUSHA, with no clear direction.
Overall Conclusion:
Based on the analysis of trend, momentum, volatility, and volume indicators, the overall outlook for RUSHA in the next few days is bearish. The trend indicators suggest a downward trajectory, while momentum indicators indicate a neutral to bearish sentiment. Volatility remains stable, and volume indicators show mixed signals.
Recommendation:
Considering the bearish trend and momentum, investors may consider short-term selling opportunities or adopting a wait-and-see approach before entering a position. It is essential to monitor the price action closely and wait for more definitive signals before making any significant investment decisions.
Disclaimer:
Please note that technical analysis is not a guaranteed predictor of future price movements, and other fundamental factors can influence stock prices. It is crucial to conduct thorough research and consider multiple indicators before making investment decisions. Consulting with a financial advisor is recommended for personalized investment advice tailored to individual risk tolerance and financial goals.