Technical Analysis of RYAAY 2024-05-10
Overview:
In analyzing the technical indicators for RYAAY over the last 5 days, we will delve into the trend, momentum, volatility, and volume indicators to provide a comprehensive outlook on the possible stock price movement in the coming days. By examining these key aspects, we aim to offer valuable insights and predictions to guide investment decisions.
Trend Analysis:
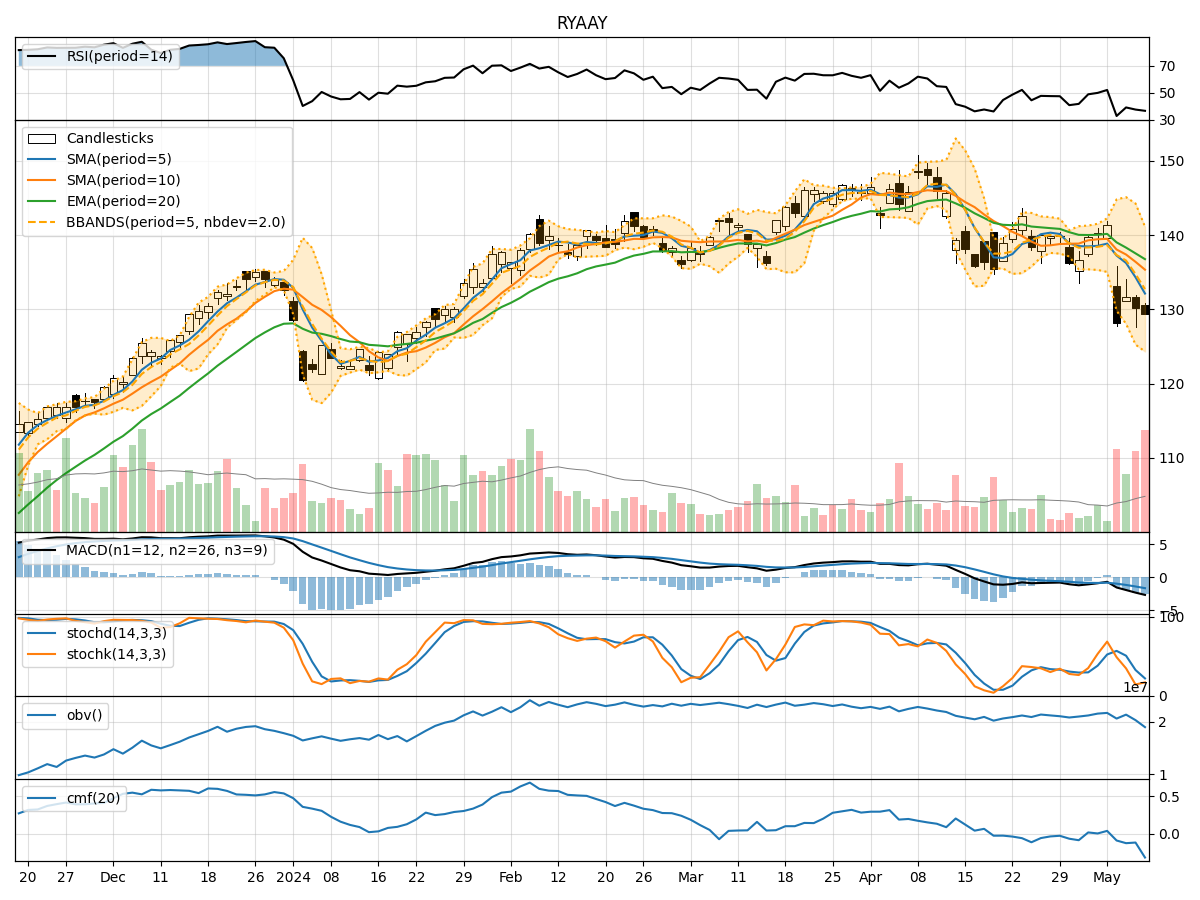
- Moving Averages (MA): The 5-day MA has been consistently below the closing prices, indicating a short-term downtrend.
- MACD: The MACD line has been decreasing, with the MACD line crossing below the signal line, suggesting a bearish momentum.
- EMA: The EMA has been trending downwards, reflecting a weakening trend.
Key Observation: The trend indicators point towards a bearish sentiment in the short term.
Momentum Analysis:
- RSI: The RSI has been declining and is currently below 50, indicating a weakening momentum.
- Stochastic Oscillator: Both %K and %D have been decreasing, signaling a bearish momentum.
- Williams %R: The indicator is in the oversold territory, suggesting a potential reversal.
Key Observation: Momentum indicators align with the bearish trend, indicating a lack of strong buying pressure.
Volatility Analysis:
- Bollinger Bands (BB): The stock price has been trading below the lower Bollinger Band, indicating oversold conditions.
- Bollinger Band Width (BBW): The BBW has been expanding, suggesting increased volatility.
- Bollinger Band %B (BBP): The %B is below 0.2, indicating potential oversold conditions.
Key Observation: Volatility indicators point towards oversold conditions, which could lead to a potential reversal or consolidation.
Volume Analysis:
- On-Balance Volume (OBV): The OBV has been consistently negative, indicating distribution.
- Chaikin Money Flow (CMF): The CMF is negative, reflecting selling pressure.
Key Observation: Volume indicators support the bearish sentiment, showing a lack of accumulation and potential selling pressure.
Conclusion:
Based on the analysis of the technical indicators across trend, momentum, volatility, and volume, the outlook for RYAAY in the next few days is bearish. The trend is downward, momentum is weakening, volatility is high but potentially oversold, and volume indicates selling pressure.
Key Conclusion: The stock is likely to experience further downward movement in the coming days. Traders should exercise caution and consider short-term bearish strategies or wait for signs of a reversal before considering long positions.