Technical Analysis of SAI 2024-05-10
Overview:
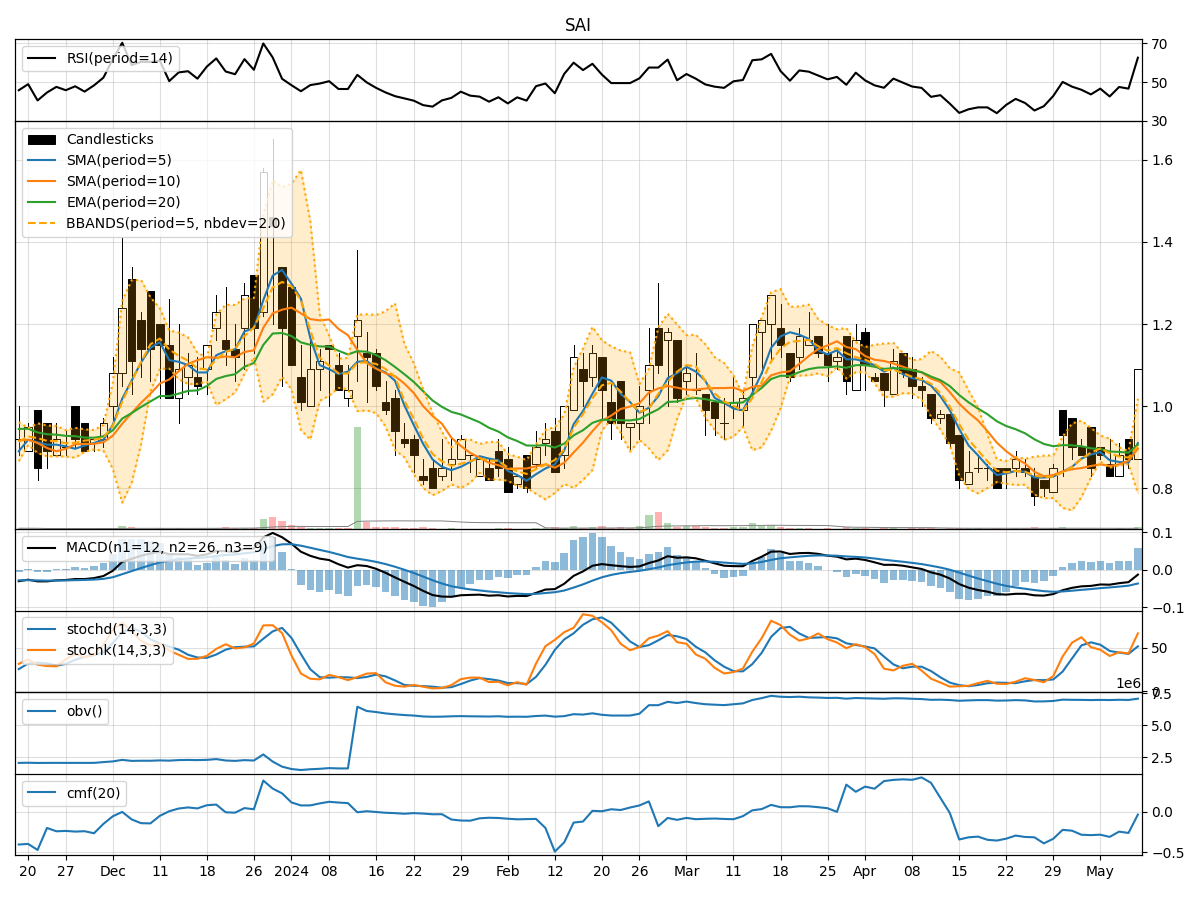
In analyzing the technical indicators for SAI stock over the last 5 days, we will delve into the trend, momentum, volatility, and volume indicators to provide a comprehensive outlook on the possible stock price movement in the coming days.
Trend Analysis:
- Moving Averages (MA): The 5-day MA has been fluctuating around the closing prices, indicating short-term price trends. The SMA(10) and EMA(20) have shown a slight increase but remain below the current price.
- MACD: The MACD line has been negative, indicating a bearish trend, but the recent increase in the MACD histogram suggests a potential reversal.
Momentum Analysis:
- RSI: The RSI has been fluctuating around the 50 level, indicating indecision in the market.
- Stochastic Oscillator: Both %K and %D have been in the overbought zone, suggesting a potential reversal or consolidation.
Volatility Analysis:
- Bollinger Bands (BB): The recent expansion of the Bollinger Bands suggests increased volatility, with the current price nearing the upper band.
Volume Analysis:
- On-Balance Volume (OBV): The OBV has been relatively stable, indicating no significant divergence between price and volume movements.
- Chaikin Money Flow (CMF): The CMF has been negative, indicating selling pressure in the market.
Key Observations:
- The trend indicators show a potential reversal in the MACD, but the moving averages are still below the current price.
- Momentum indicators suggest indecision with RSI around 50 and stochastic oscillators in the overbought zone.
- Volatility has increased, as seen in the widening Bollinger Bands.
- Volume indicators show no significant divergence between price and volume movements.
Conclusion:
Based on the analysis of the technical indicators, the stock price of SAI is likely to experience further upward movement in the coming days. The potential reversal in the MACD, coupled with increased volatility and stable volume, indicates a bullish outlook. However, caution is advised due to the indecision in momentum indicators and the possibility of a short-term consolidation or pullback. Traders should closely monitor the MACD for confirmation of the bullish trend and set appropriate stop-loss levels to manage risk.