Technical Analysis of SBLK 2024-05-10
Overview:
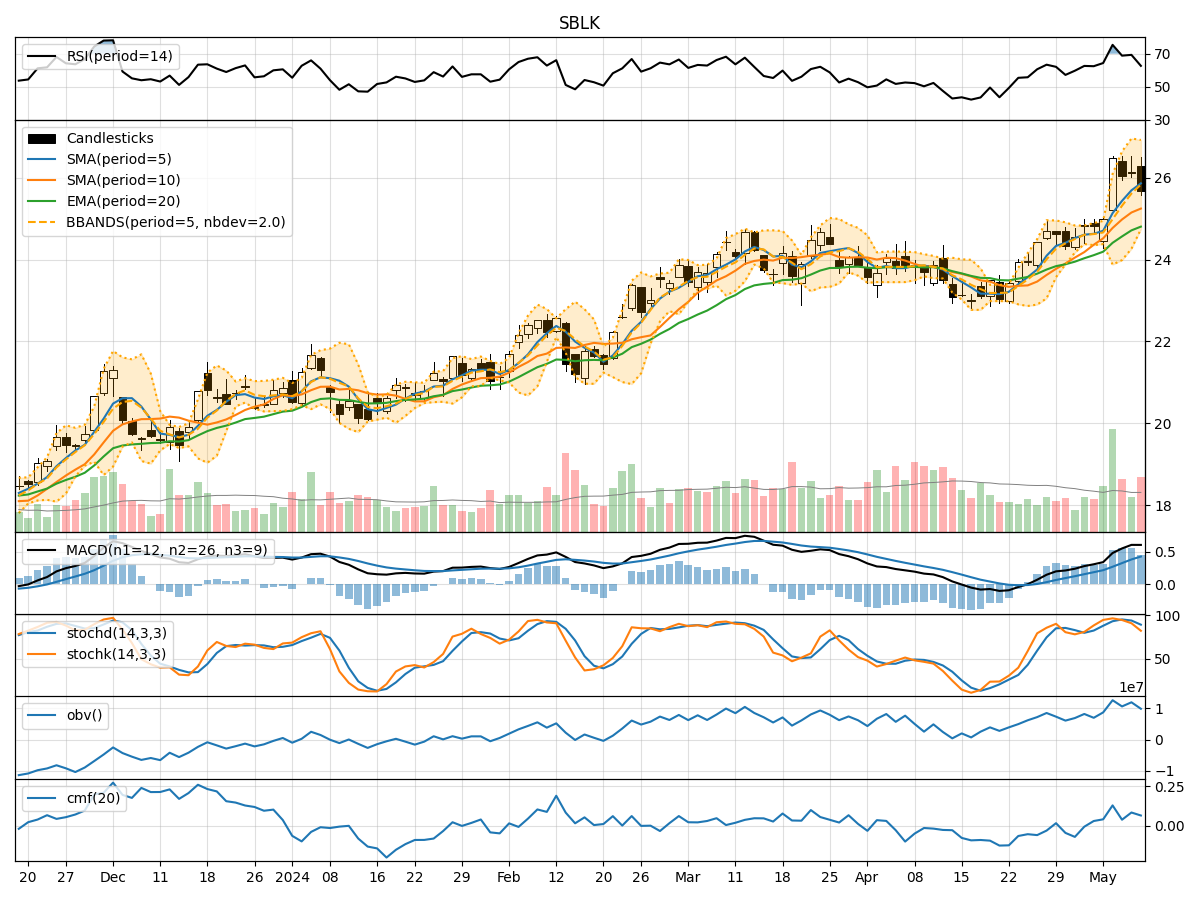
In analyzing the technical indicators for SBLK over the last 5 days, we will delve into the trend, momentum, volatility, and volume indicators to provide a comprehensive outlook on the possible stock price movement. By examining these key factors, we aim to offer valuable insights and predictions for the upcoming days.
Trend Analysis:
- Moving Averages (MA): The 5-day Moving Average (MA) has been consistently above the closing prices, indicating a bullish trend.
- MACD: The Moving Average Convergence Divergence (MACD) has shown positive values, suggesting upward momentum in the stock price.
- EMA: The Exponential Moving Average (EMA) has been trending upwards, supporting the bullish sentiment.
Key Observation: The trend indicators point towards an upward trajectory for SBLK.
Momentum Analysis:
- RSI: The Relative Strength Index (RSI) has been fluctuating but remains in the neutral zone, indicating a balanced momentum.
- Stochastic Oscillator: Both %K and %D values have been declining, signaling a potential slowdown in momentum.
- Williams %R: The Williams %R is in the oversold territory, suggesting a possible reversal in momentum.
Key Observation: The momentum indicators reflect a neutral to slightly bearish sentiment.
Volatility Analysis:
- Bollinger Bands (BB): The Bollinger Bands have shown narrowing, indicating decreasing volatility in the stock price.
- BB %B: The %B value is relatively low, suggesting a potential consolidation phase.
- Average True Range (ATR): The ATR has been decreasing, further supporting the low volatility environment.
Key Observation: Volatility indicators point towards a consolidation phase.
Volume Analysis:
- On-Balance Volume (OBV): The OBV has shown mixed movements, indicating indecision among market participants.
- Chaikin Money Flow (CMF): The CMF remains positive but has been trending downwards, signaling a potential decrease in buying pressure.
Key Observation: Volume indicators suggest a mixed sentiment with a slight bias towards selling pressure.
Conclusion:
Based on the analysis of trend, momentum, volatility, and volume indicators, the next few days for SBLK could see a sideways movement with a slight bearish bias. While the trend indicators point towards an upward trajectory, the momentum and volume indicators suggest a potential slowdown and mixed sentiment among investors. The low volatility environment indicates a consolidation phase, further supporting the view of a sideways movement.
In conclusion, the stock price of SBLK is likely to experience a period of consolidation with a neutral to slightly bearish outlook in the upcoming days.