Technical Analysis of SCNI 2024-05-10
Overview:
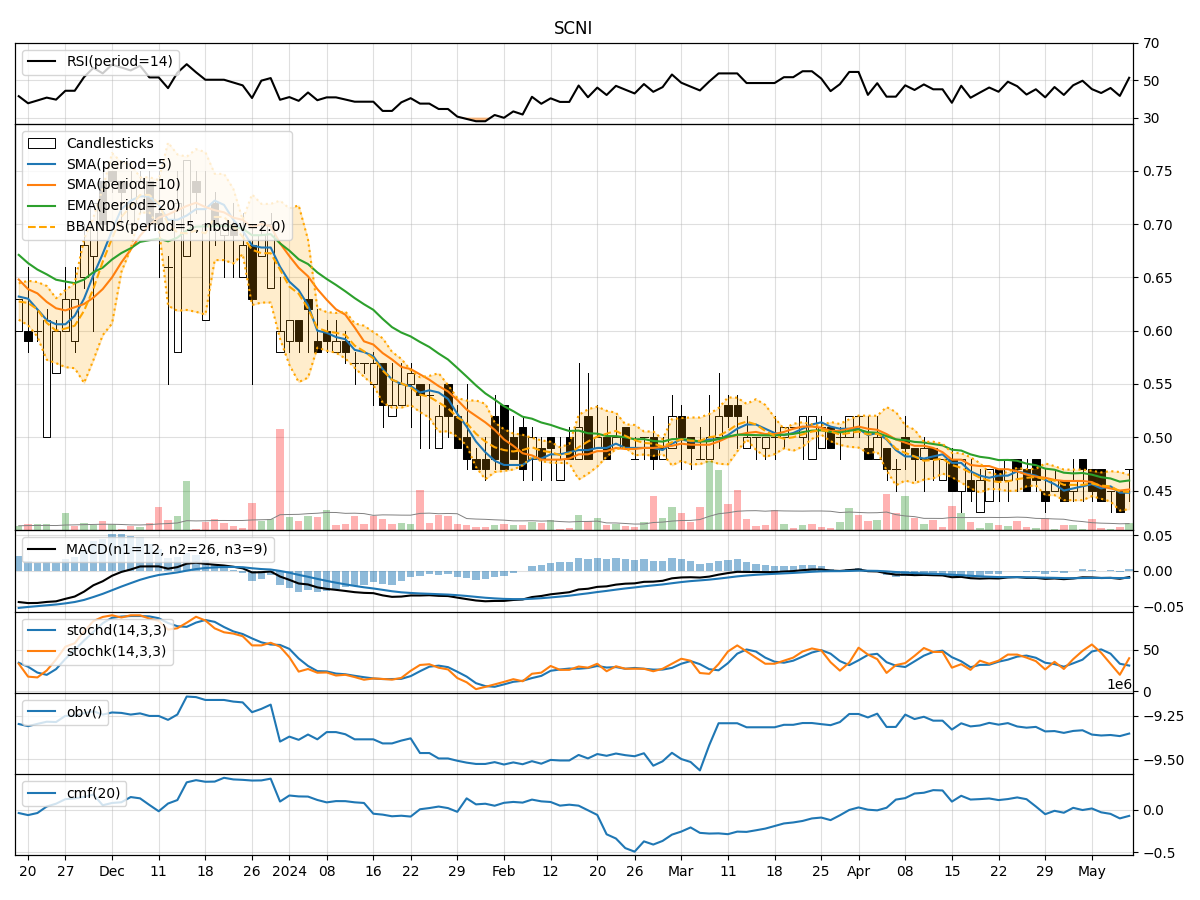
In analyzing the technical indicators for SCNI over the last 5 days, we will delve into the trend, momentum, volatility, and volume indicators to provide a comprehensive outlook on the possible stock price movement. By examining these key indicators, we aim to offer valuable insights and predictions for the upcoming days.
Trend Indicators:
- Moving Averages (MA): The 5-day MA has been fluctuating around the closing prices, indicating a lack of clear trend direction.
- MACD: The MACD has been consistently negative, suggesting a bearish momentum in the short term.
- Relative Strength Index (RSI): The RSI has been oscillating around the 50 level, reflecting a neutral sentiment in the market.
Momentum Indicators:
- Stochastic Oscillator: The Stochastic indicators have been showing mixed signals, with fluctuations in both %K and %D values.
- Williams %R (WillR): The Williams %R has been moving between oversold and neutral levels, indicating indecision among traders.
Volatility Indicators:
- Bollinger Bands (BB): The Bollinger Bands have shown narrowing bands, suggesting decreasing volatility in the stock.
- Average True Range (ATR): The ATR values have been relatively stable, indicating a lack of significant price movements.
Volume Indicators:
- On-Balance Volume (OBV): The OBV has been fluctuating, indicating a balance between buying and selling pressure.
- Chaikin Money Flow (CMF): The CMF has been negative, signaling a bearish money flow in the stock.
Key Observations:
- The trend indicators suggest a lack of clear direction in the stock's movement.
- Momentum indicators show mixed signals, indicating uncertainty among traders.
- Volatility has been decreasing, potentially leading to a period of consolidation.
- Volume indicators reflect a balanced market sentiment with a slight bearish bias.
Conclusion:
Based on the analysis of the technical indicators, the stock price of SCNI is likely to experience sideways movement in the upcoming days. The lack of a clear trend, mixed momentum signals, decreasing volatility, and balanced volume indicate a period of consolidation. Traders should exercise caution and wait for clearer signals before making significant trading decisions.