Technical Analysis of SDA 2024-05-10
Overview:
In analyzing the technical indicators for SDA stock over the last 5 days, we will delve into the trend, momentum, volatility, and volume indicators to provide a comprehensive outlook on the possible stock price movement in the coming days. By examining these key indicators, we aim to offer valuable insights and predictions for informed decision-making.
Trend Analysis:
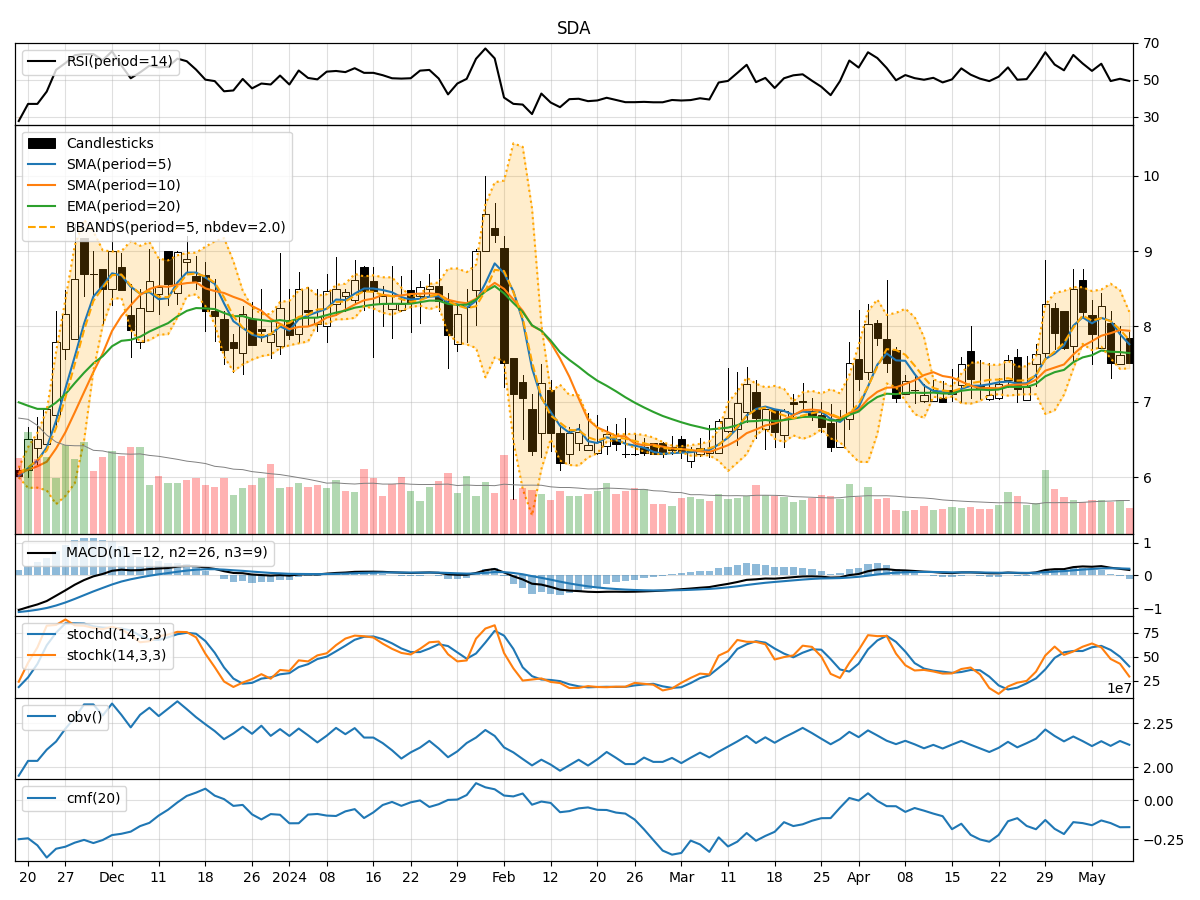
- Moving Averages (MA): The 5-day MA has been fluctuating around the actual closing prices, indicating short-term price trends. The SMA(10) and EMA(20) have shown some divergence, suggesting potential shifts in momentum.
- MACD and Signal Line: The MACD has been positive, indicating bullish momentum, but the recent decrease in the MACD histogram suggests a possible weakening of the uptrend.
Momentum Analysis:
- RSI: The RSI values have been hovering around the neutral zone, indicating a lack of strong buying or selling pressure.
- Stochastic Oscillator: Both %K and %D have been declining, signaling a potential bearish momentum.
- Williams %R: The Williams %R values have been consistently in the oversold territory, suggesting a possible reversal in the short term.
Volatility Analysis:
- Bollinger Bands (BB): The narrowing of the bands indicates decreasing volatility, which could precede a period of consolidation or a significant price movement.
- Bollinger %B: The %B values have been fluctuating, reflecting the price's relationship to the bands and potential reversal points.
Volume Analysis:
- On-Balance Volume (OBV): The OBV has shown mixed signals, indicating indecision among market participants regarding the stock's direction.
- Chaikin Money Flow (CMF): The CMF has been negative, suggesting outflow of money from the stock.
Key Observations and Opinions:
- Trend: The trend indicators show a mixed picture, with potential for a shift in momentum.
- Momentum: The momentum indicators suggest a bearish bias, with weakening buying pressure.
- Volatility: Decreasing volatility may lead to a period of consolidation or a breakout.
- Volume: The volume indicators reflect uncertainty and lack of strong conviction among traders.
Conclusion:
Based on the analysis of the technical indicators, the stock price of SDA is likely to experience further downward movement in the coming days. The bearish momentum indicated by the stochastic oscillator and Williams %R, coupled with the weakening trend signals from the MACD, point towards a potential downtrend. Additionally, the negative CMF and mixed OBV suggest a lack of strong buying interest. Traders should exercise caution and consider shorting or staying on the sidelines until clearer bullish signals emerge.