Technical Analysis of SEDG 2024-05-10
Overview:
In analyzing the technical indicators for SEDG over the last 5 days, we will delve into the trend, momentum, volatility, and volume indicators to provide a comprehensive outlook on the possible stock price movement. By examining these key aspects, we aim to offer valuable insights and predictions for the upcoming days.
Trend Analysis:
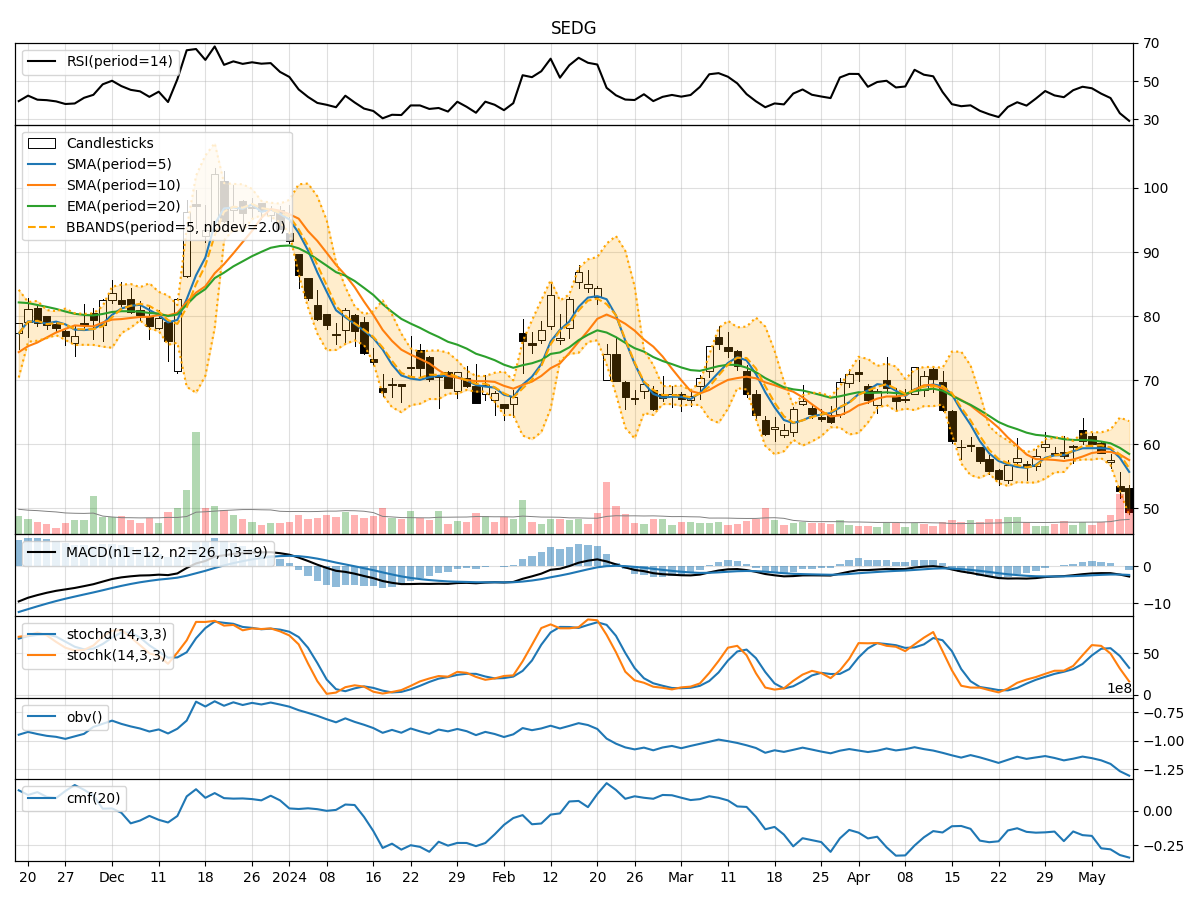
- Moving Averages (MA): The 5-day MA has been consistently decreasing, indicating a bearish trend in the short term.
- MACD: The MACD line has been below the signal line, suggesting a bearish momentum.
- EMA: The EMA has also been declining, reinforcing the bearish sentiment in the stock.
Momentum Analysis:
- RSI: The RSI has been decreasing, reflecting a weakening momentum.
- Stochastic Oscillator: Both %K and %D have been declining, indicating a bearish momentum.
- Williams %R: The indicator has been in oversold territory, signaling a potential reversal.
Volatility Analysis:
- Bollinger Bands (BB): The stock price has been consistently below the lower Bollinger Band, indicating oversold conditions.
- Bollinger Band Width (BBW): The BBW has been widening, suggesting increased volatility.
- Bollinger Band %B (BBP): The %B has been below 0.2, indicating potential oversold conditions.
Volume Analysis:
- On-Balance Volume (OBV): The OBV has been consistently negative, indicating selling pressure.
- Chaikin Money Flow (CMF): The CMF has been negative, reflecting a bearish sentiment in the stock.
Key Observations:
- The stock is currently in a strong bearish trend based on the moving averages and MACD.
- Momentum indicators such as RSI and Stochastic Oscillator suggest oversold conditions and a potential reversal.
- Volatility indicators point towards increased volatility and potential buying opportunities.
- Volume indicators indicate selling pressure and a bearish sentiment in the market.
Conclusion:
Based on the analysis of the technical indicators, the next few days are likely to see a potential reversal in the stock price. While the trend remains bearish, the oversold conditions indicated by momentum indicators and volatility signals suggest a possible upward movement in the stock price. Traders should closely monitor key levels and wait for confirmation of a trend reversal before considering any long positions.