Technical Analysis of SEED 2024-05-10
Overview:
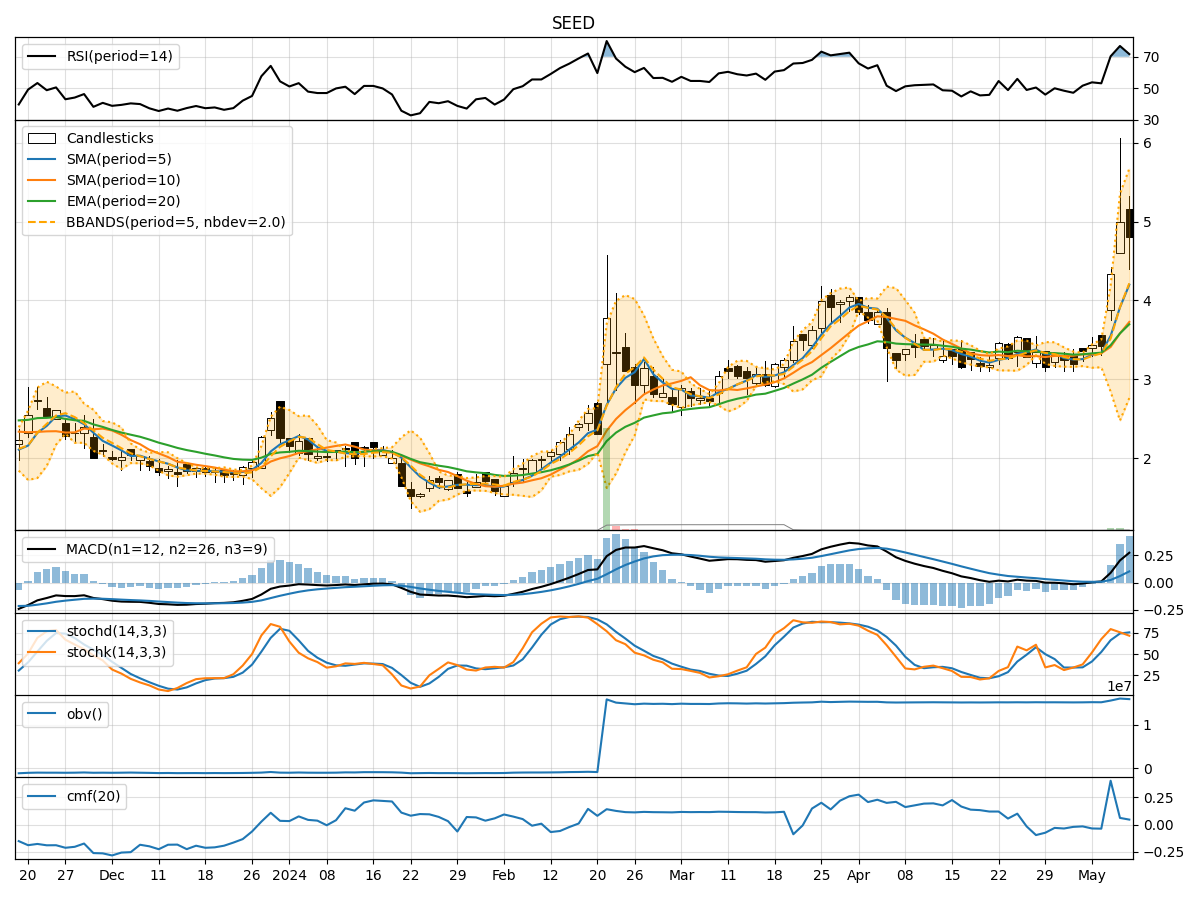
In analyzing the technical indicators for SEED over the last 5 days, we will delve into the trend, momentum, volatility, and volume indicators to provide a comprehensive assessment of the stock's potential price movement. By examining these key factors, we aim to offer valuable insights and predictions for the next few days.
Trend Indicators:
- Moving Averages (MA): The 5-day moving average has been steadily increasing, indicating a positive trend in the stock price.
- MACD: The MACD line has been consistently above the signal line, suggesting bullish momentum.
- EMA: The exponential moving average has been trending upwards, reflecting a positive price trend.
Momentum Indicators:
- RSI: The Relative Strength Index has been in the overbought territory, indicating strong buying momentum.
- Stochastic Oscillator: Both %K and %D have been relatively high, signaling potential overbought conditions.
- Williams %R: The Williams %R is in the oversold region, suggesting a possible reversal in the short term.
Volatility Indicators:
- Bollinger Bands: The Bollinger Bands have widened, indicating increased volatility in the stock price.
- Bollinger %B: The %B indicator is below 1, suggesting the stock is trading below the lower band, potentially indicating an oversold condition.
Volume Indicators:
- On-Balance Volume (OBV): The OBV has been increasing, indicating strong buying pressure.
- Chaikin Money Flow (CMF): The CMF has been positive, reflecting a bullish money flow into the stock.
Key Observations and Opinions:
- Trend: The stock is in an upward trend based on moving averages and MACD.
- Momentum: Momentum indicators suggest a mixed signal with overbought conditions in RSI and stochastic, but oversold in Williams %R.
- Volatility: Increased volatility as indicated by Bollinger Bands widening.
- Volume: Strong buying pressure shown by OBV and positive CMF.
Conclusion:
Based on the technical indicators analyzed, the next few days for SEED are likely to see continued upward movement in the stock price. The bullish trend supported by moving averages, MACD, OBV, and CMF signals a positive outlook. However, caution is advised due to the mixed signals in momentum indicators and increased volatility. Traders should closely monitor price action and key support/resistance levels for potential entry and exit points.
Recommendation:
Consider buying on dips within the overall bullish trend, but ensure to set stop-loss orders to manage risk. Monitoring key levels such as the 5-day moving average and support/resistance zones can provide valuable insights for trading decisions. Stay vigilant for any signs of trend reversal or overbought conditions in momentum indicators.