Technical Analysis of SHC 2024-05-10
Overview:
In analyzing the technical indicators for SHC over the last 5 days, we will delve into the trend, momentum, volatility, and volume indicators to provide a comprehensive outlook on the possible stock price movement. By examining these key aspects, we aim to offer valuable insights and predictions for the upcoming days.
Trend Analysis:
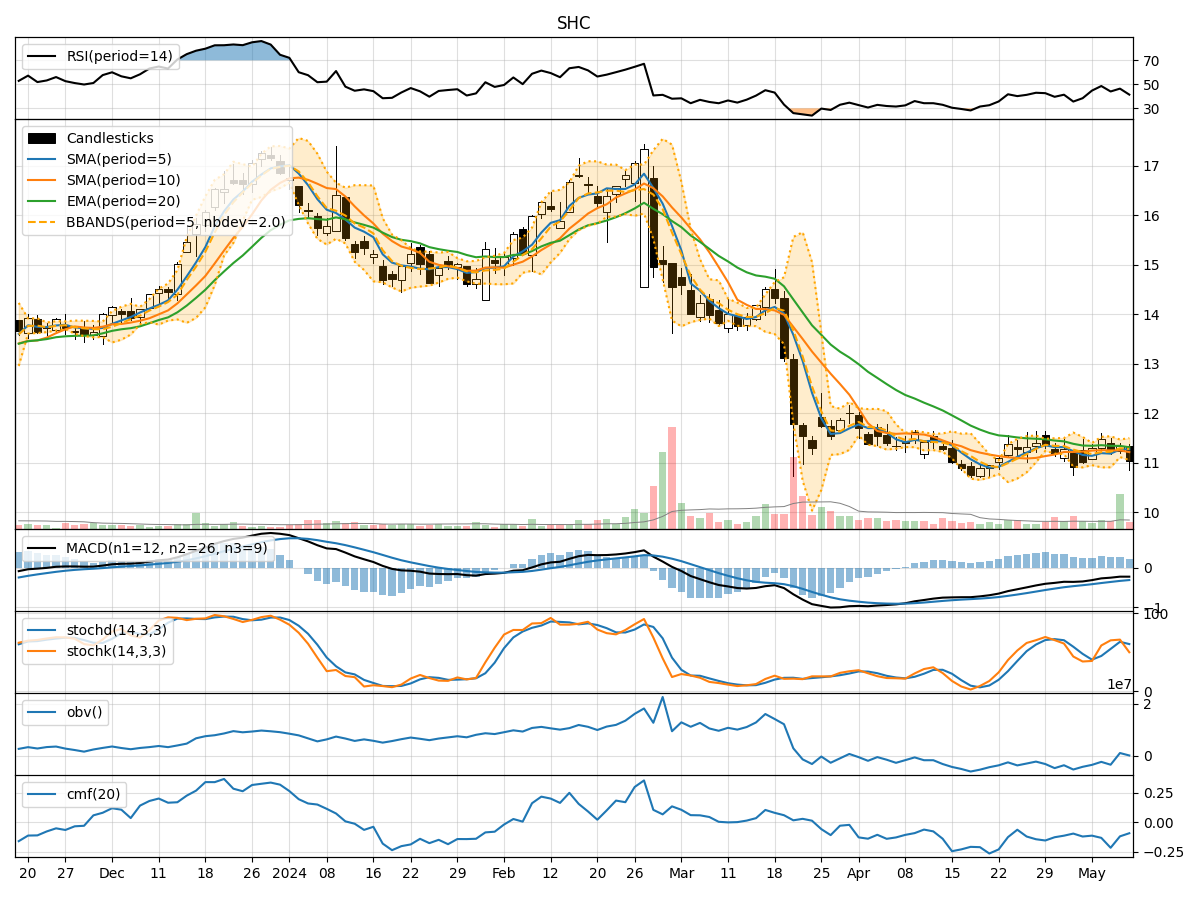
- Moving Averages (MA): The 5-day Moving Average (MA) has been fluctuating around the closing prices, indicating short-term price trends. The Simple Moving Average (SMA) and Exponential Moving Average (EMA) show a slight downward trend, with the EMA lagging behind.
- Moving Average Convergence Divergence (MACD): The MACD and Signal Line have been negative, suggesting a bearish momentum in the stock price.
- Conclusion: The trend indicators point towards a downward trajectory in the stock price.
Momentum Analysis:
- Relative Strength Index (RSI): The RSI has been hovering around the mid-range, indicating a neutral momentum in the stock.
- Stochastic Oscillator (Stoch): Both %K and %D have shown fluctuations but are not in extreme overbought or oversold territories.
- Williams %R (WillR): The Williams %R is in the oversold region, suggesting a potential reversal.
- Conclusion: The momentum indicators suggest a neutral to slightly bearish sentiment in the stock price.
Volatility Analysis:
- Bollinger Bands (BB): The stock price has been trading within the Bollinger Bands, with the bands narrowing, indicating reduced volatility.
- Conclusion: Volatility indicators signal a consolidation phase in the stock price.
Volume Analysis:
- On-Balance Volume (OBV): The OBV has shown a mixed trend, indicating indecision among investors.
- Chaikin Money Flow (CMF): The CMF has been negative, reflecting selling pressure in the stock.
- Conclusion: Volume indicators suggest a bearish sentiment in the stock price.
Overall Conclusion:
Based on the analysis of trend, momentum, volatility, and volume indicators, the next few days' possible stock price movement for SHC is likely to be downward. The trend indicators point towards a bearish trajectory, supported by the negative momentum and volume indicators. The volatility analysis indicates a consolidation phase, which could precede a potential downward movement. Investors should exercise caution and consider risk management strategies in light of the bearish outlook.
Recommendation:
Given the overall bearish sentiment in the technical indicators, it is advisable to consider a sell or short position in SHC for the next few days. Traders should closely monitor key support levels and set stop-loss orders to manage potential risks. Additionally, staying informed about any market developments or news that could impact the stock price is crucial for making well-informed trading decisions.
By carefully analyzing the technical indicators and market dynamics, investors can position themselves strategically to capitalize on potential price movements and mitigate risks effectively.