Technical Analysis of SILC 2024-05-10
Overview:
In analyzing the technical indicators for SILC over the last 5 days, we will delve into the trend, momentum, volatility, and volume indicators to provide a comprehensive assessment of the stock's potential price movement. By examining these key factors, we aim to offer valuable insights and predictions for the next few days.
Trend Analysis:
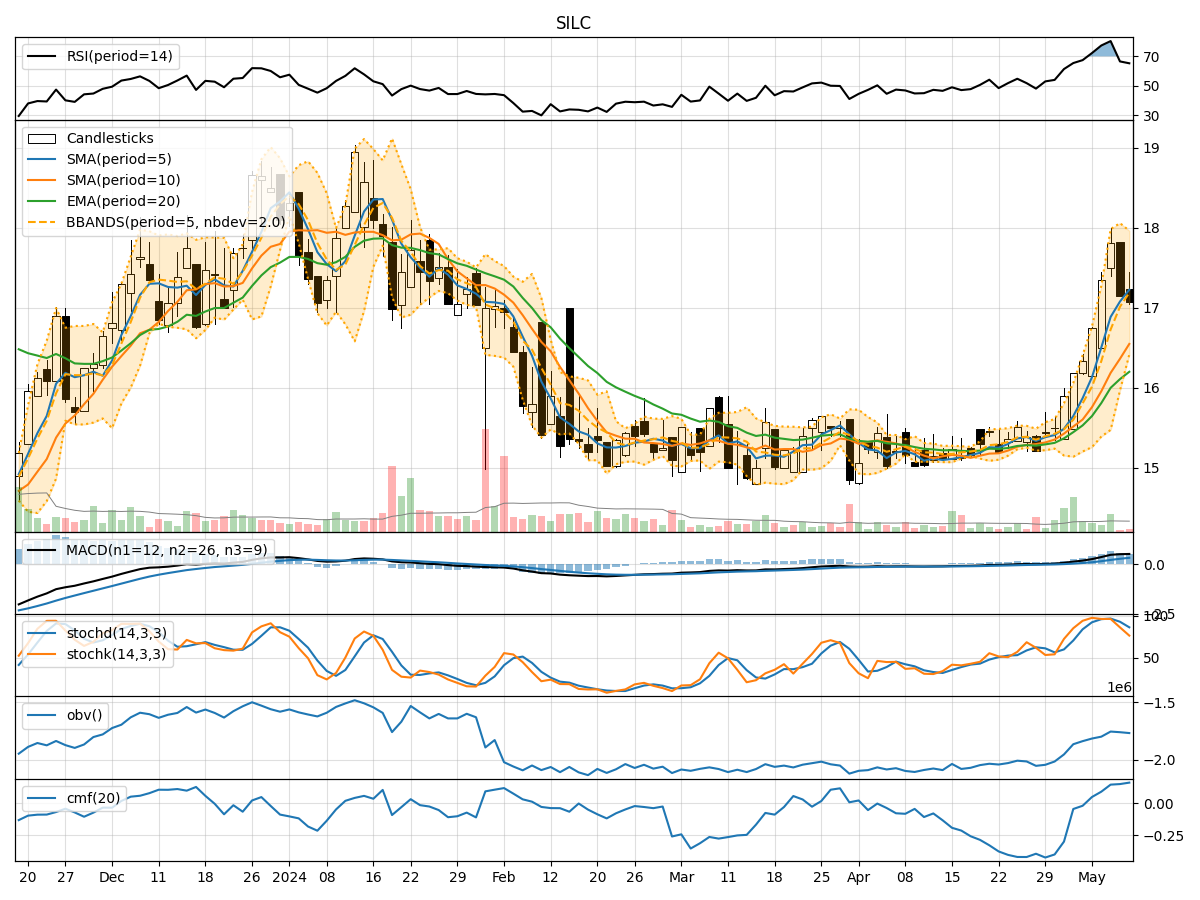
- Moving Averages (MA): The 5-day Moving Average (MA) has been consistently above the closing prices, indicating an upward trend.
- MACD: The Moving Average Convergence Divergence (MACD) has shown positive values, suggesting bullish momentum.
Key Observation: The trend indicators point towards an upward trajectory for SILC.
Momentum Analysis:
- RSI: The Relative Strength Index (RSI) has been fluctuating but generally staying within the overbought territory, indicating strong buying momentum.
- Stochastic Oscillator: Both %K and %D have been declining, signaling a potential reversal in momentum.
Key Observation: Momentum indicators suggest a mixed sentiment with a possibility of a reversal in the near future.
Volatility Analysis:
- Bollinger Bands (BB): The Bollinger Bands have been widening, indicating increased volatility in the stock price.
Key Observation: Volatility is on the rise, which could lead to larger price swings.
Volume Analysis:
- On-Balance Volume (OBV): The OBV has been increasing, reflecting higher buying volume.
- Chaikin Money Flow (CMF): The CMF has been positive, indicating strong buying pressure.
Key Observation: Volume indicators suggest bullish sentiment with increasing buying pressure.
Conclusion:
Based on the analysis of the technical indicators, the overall outlook for SILC in the next few days is bullish. The trend indicators support an upward trajectory, while momentum indicators hint at a potential reversal. Volatility is increasing, which could lead to larger price movements, and volume indicators indicate strong buying pressure.
Recommendation:
Considering the bullish trend and positive volume indicators, it is advisable to consider buying SILC in the short term. However, it is essential to monitor the momentum indicators closely for any signs of a potential reversal. Traders should set appropriate stop-loss levels to manage risk effectively.
In conclusion, SILC shows promising signs of upward movement, but caution and risk management are crucial in navigating the market dynamics.