Technical Analysis of SIRI 2024-05-10
Overview:
In analyzing the technical indicators for SIRI over the last 5 days, we will delve into the trend, momentum, volatility, and volume indicators to provide a comprehensive outlook on the possible stock price movement in the coming days. By examining these key aspects, we aim to offer valuable insights and recommendations for potential investors.
Trend Analysis:
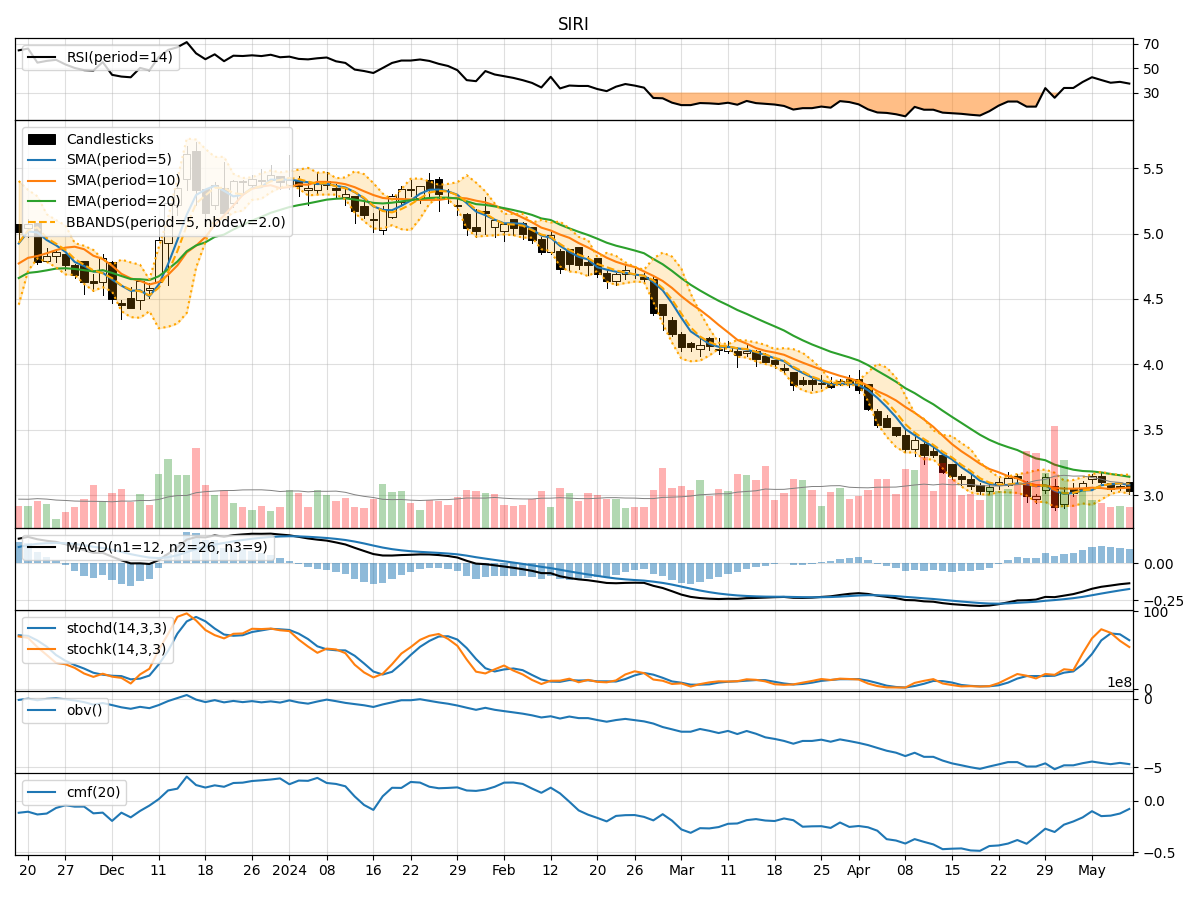
- Moving Averages (MA): The 5-day MA has been fluctuating around the closing prices, indicating short-term price trends. The SMA(10) and EMA(20) show a downward trend, suggesting a bearish sentiment in the medium to long term.
- MACD and Signal Line: The MACD line has been consistently below the signal line, indicating a bearish trend in the stock price movement.
- MACD Histogram: The histogram has been positive but decreasing, signaling a potential reversal or slowdown in the bearish momentum.
Momentum Analysis:
- RSI: The RSI has been hovering around the oversold territory, indicating a potential reversal or consolidation phase.
- Stochastic Oscillator: Both %K and %D have been declining, suggesting a bearish momentum in the stock.
- Williams %R: The indicator has been in the oversold region, indicating a potential buying opportunity in the near future.
Volatility Analysis:
- Bollinger Bands: The stock price has been trading within the lower Bollinger Band, indicating a potential oversold condition.
- Bollinger %B: The %B indicator is below 0.2, suggesting a possible undervalued situation.
- Average True Range (ATR): The ATR has been relatively stable, indicating consistent price movements without significant volatility spikes.
Volume Analysis:
- On-Balance Volume (OBV): The OBV has been declining, indicating selling pressure in the stock.
- Chaikin Money Flow (CMF): The CMF has been negative, suggesting a bearish sentiment in the stock based on both price and volume.
Conclusion:
Based on the analysis of the technical indicators, the stock of SIRI is currently in a bearish phase. The trend indicators, momentum oscillators, and volume analysis all point towards a downward movement in the stock price in the coming days. The oversold conditions in RSI and Williams %R may lead to a short-term bounce, but the overall trend remains bearish. Investors should exercise caution and consider waiting for more definitive signals of a trend reversal before considering any long positions.