Technical Analysis of SISI 2024-05-10
Overview:
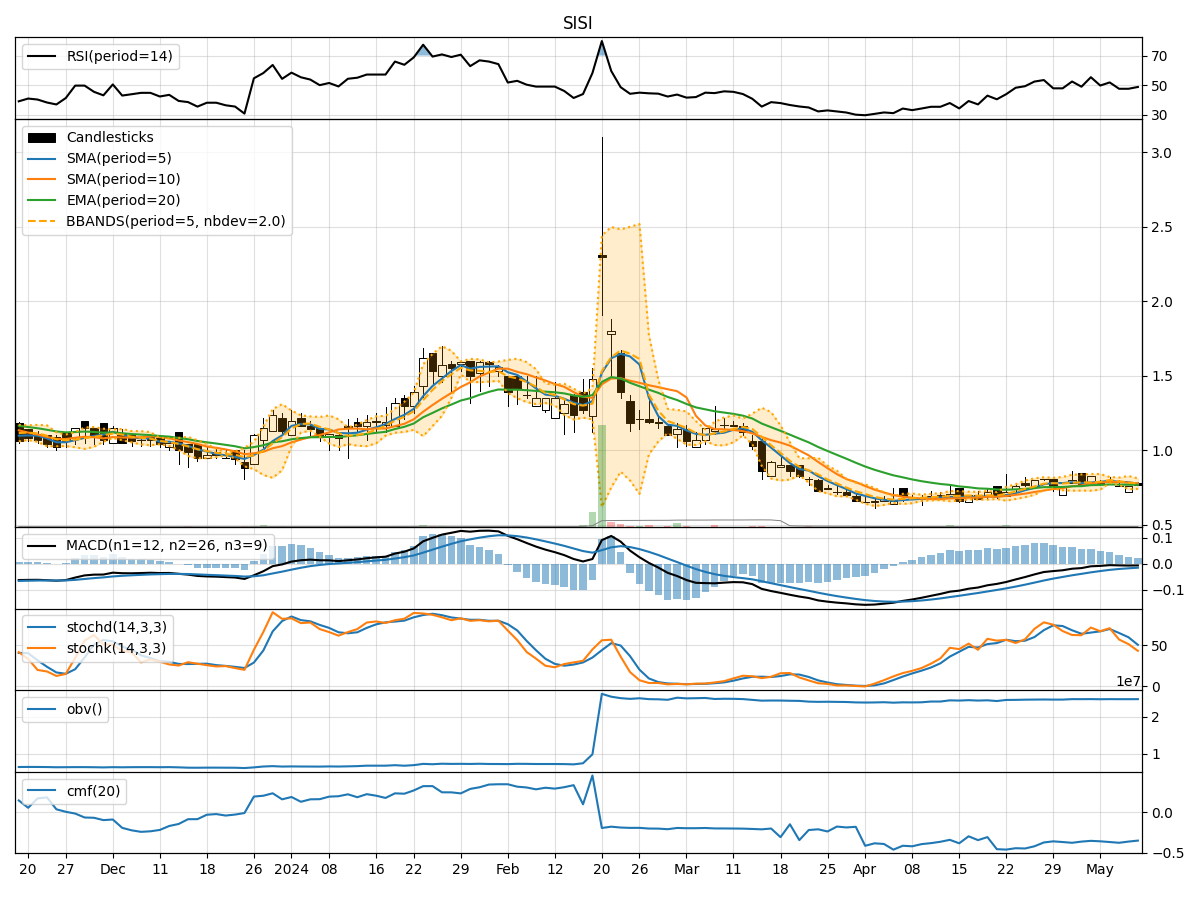
In the last 5 trading days, SISI stock has shown mixed signals across various technical indicators. The stock price has fluctuated within a narrow range, indicating indecision in the market. We will analyze the trend, momentum, volatility, and volume indicators to determine the possible future stock price movement.
Trend Analysis:
- Moving averages (MA) show a slight downtrend, with the 5-day MA below the 10-day simple moving average (SMA).
- Exponential moving average (EMA) has been relatively flat, indicating a lack of strong trend direction.
- MACD is negative, suggesting a bearish momentum in the short term.
Momentum Analysis:
- Relative Strength Index (RSI) is hovering around the neutral zone, indicating a lack of strong buying or selling pressure.
- Stochastic indicators are in the oversold region, suggesting a potential reversal or consolidation.
- Williams %R is also in the oversold territory, signaling a possible buying opportunity.
Volatility Analysis:
- Bollinger Bands are narrowing, indicating decreasing volatility and a potential breakout in the near future.
- Bollinger Band %B is around 0.5, suggesting the stock is trading near the middle of the bands.
- Volatility indicators show a decrease in price fluctuations.
Volume Analysis:
- On-Balance Volume (OBV) has been relatively flat, indicating a balance between buying and selling pressure.
- Chaikin Money Flow (CMF) is negative, suggesting outflow of money from the stock.
Key Observations:
- The stock is currently in a consolidation phase with no clear trend direction.
- Momentum indicators suggest a potential reversal or consolidation in the near term.
- Volatility is decreasing, indicating a period of low price fluctuations.
- Volume indicators show a lack of significant buying or selling pressure.
Conclusion:
Based on the analysis of technical indicators, the stock is likely to continue trading sideways in the near term. The lack of strong trend direction, coupled with mixed signals from momentum and volume indicators, suggests a period of consolidation. Traders may consider waiting for a clear breakout above the resistance or below the support levels before taking any significant positions. The stock is expected to remain range-bound in the coming days.
Disclaimer:
This analysis is based solely on technical indicators and historical data. It is essential to consider other factors such as market news, economic events, and company fundamentals before making any investment decisions. Always conduct thorough research and consult with a financial advisor before making any trading or investment choices.