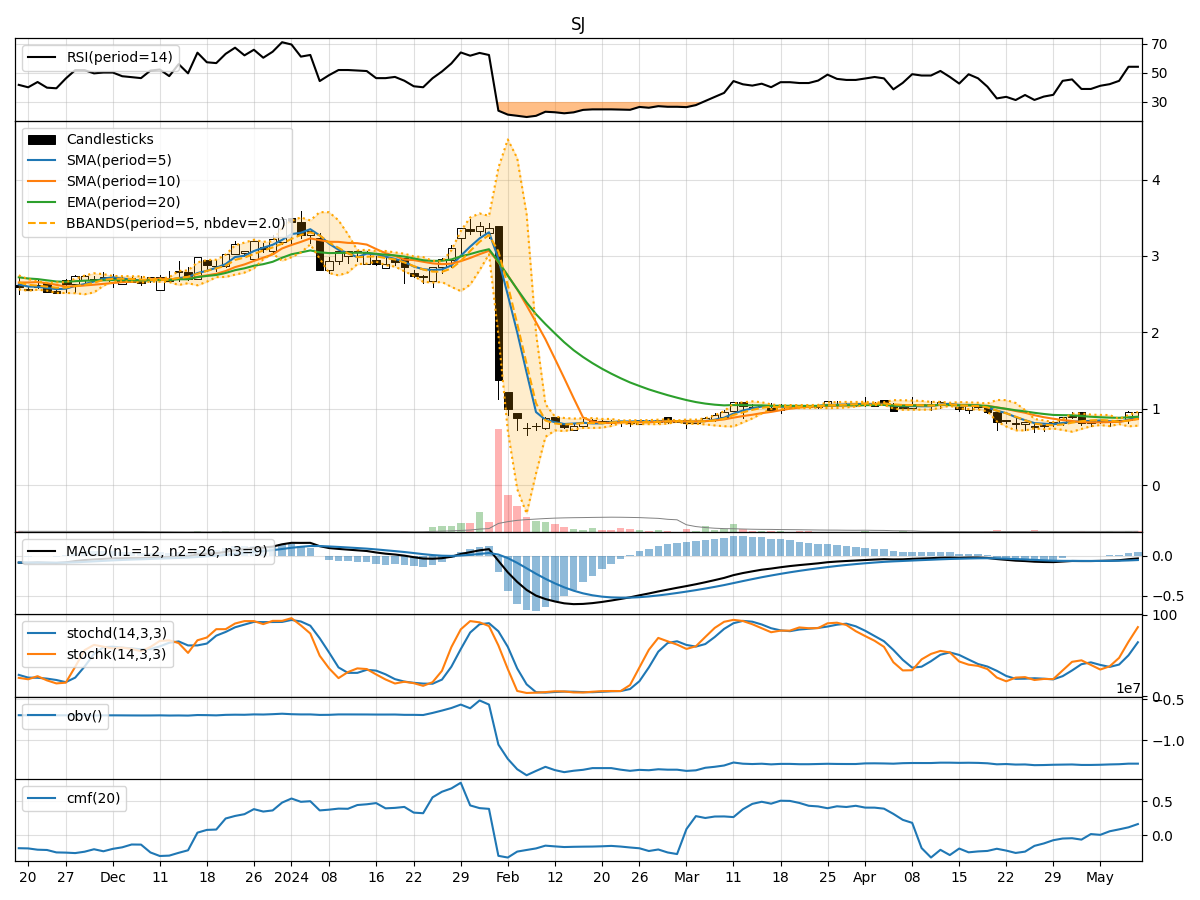
Technical Analysis of SJ 2024-05-10
Overview:
In analyzing the technical indicators for SJ stock over the last 5 days, we will delve into the trend, momentum, volatility, and volume indicators to provide a comprehensive outlook on the possible stock price movement in the coming days. By examining these key indicators, we aim to offer valuable insights and predictions to guide your investment decisions.
Trend Analysis:
- Moving Averages (MA): The 5-day MA has been fluctuating around the closing prices, indicating short-term price trends. The SMA(10) and EMA(20) show a slight downward trend, suggesting a potential bearish sentiment.
- MACD: The MACD line has been negative, with the MACD histogram showing a decreasing trend. This indicates a bearish momentum in the stock price.
- Conclusion: The trend indicators suggest a bearish outlook for SJ stock in the near term.
Momentum Analysis:
- RSI: The RSI values have been increasing, indicating a strengthening momentum in the stock price.
- Stochastic Oscillator: Both %K and %D values have been rising, suggesting an increasing buying pressure.
- Williams %R: The values have been improving, moving towards the oversold region.
- Conclusion: The momentum indicators point towards a bullish momentum for SJ stock.
Volatility Analysis:
- Bollinger Bands: The bands have widened, indicating increased price volatility. The current price is close to the upper band, suggesting a potential overbought condition.
- Conclusion: The volatility indicators signal a high volatility environment for SJ stock.
Volume Analysis:
- On-Balance Volume (OBV): The OBV has been relatively stable, indicating a balance between buying and selling pressure.
- Chaikin Money Flow (CMF): The CMF has been positive, indicating a bullish money flow into the stock.
- Conclusion: The volume indicators suggest a neutral to slightly bullish sentiment for SJ stock.
Overall Conclusion:
Based on the analysis of trend, momentum, volatility, and volume indicators, the following conclusions can be drawn: - Trend: The trend indicators point towards a bearish outlook. - Momentum: The momentum indicators suggest a bullish momentum. - Volatility: The volatility indicators indicate high volatility in the stock. - Volume: The volume indicators lean towards a neutral to slightly bullish sentiment.
Final Recommendation:
Considering the mixed signals from the technical indicators, it is essential to proceed with caution. The bearish trend and high volatility may pose risks, but the bullish momentum and positive volume flow could offer opportunities for short-term gains. It is advisable to closely monitor the stock price movement and consider setting appropriate stop-loss levels to manage risks effectively.
Disclaimer:
This analysis is based solely on technical indicators and historical data. It is crucial to conduct thorough research, consider fundamental factors, and consult with a financial advisor before making any investment decisions. Market conditions can change rapidly, impacting stock prices unpredictably.