Technical Analysis of SMX 2024-05-10
Overview:
In analyzing the technical indicators for SMX over the last 5 days, we will delve into the trend, momentum, volatility, and volume indicators to provide a comprehensive outlook on the possible stock price movement in the coming days. By examining these key aspects, we aim to offer valuable insights and predictions to guide your investment decisions.
Trend Indicators:
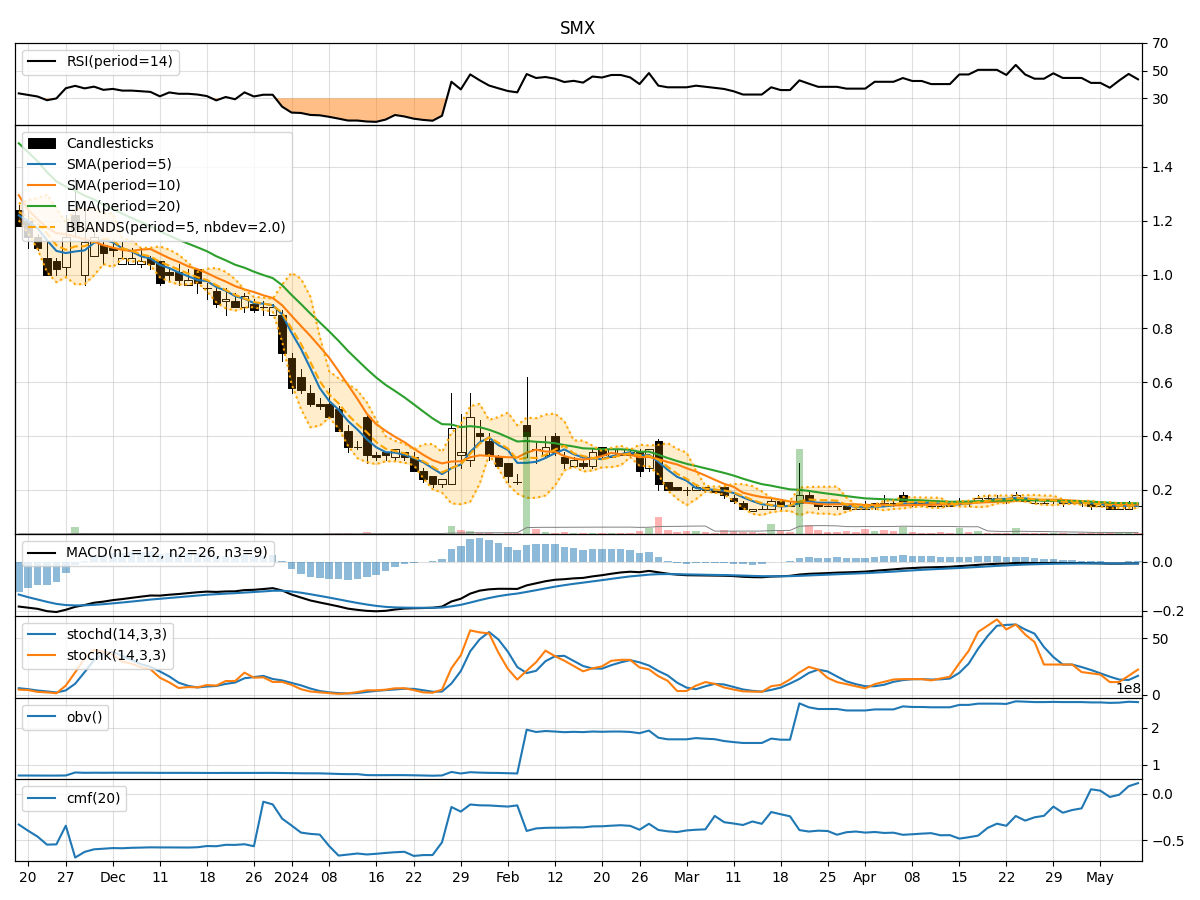
- Moving Averages (MA): The 5-day moving average (MA) has been consistently below the simple moving average (SMA) and exponential moving average (EMA) over the past 5 days, indicating a downward trend.
- MACD: The MACD line has been negative, with the MACD histogram also showing a downward trend, suggesting bearish momentum in the stock price.
Momentum Indicators:
- RSI: The Relative Strength Index (RSI) has been hovering around 40-50, indicating a neutral momentum in the stock.
- Stochastic Oscillator: Both %K and %D have been relatively low, suggesting a lack of strong buying or selling pressure.
- Williams %R: The Williams %R has been consistently in the oversold territory, indicating a potential reversal in the stock price.
Volatility Indicators:
- Bollinger Bands: The Bollinger Bands have been narrowing, indicating decreasing volatility in the stock price.
- Bollinger %B: The %B value has been around 0.5, suggesting the stock is trading near the middle of the bands.
Volume Indicators:
- On-Balance Volume (OBV): The OBV has shown mixed signals, with fluctuations in volume but no clear trend.
- Chaikin Money Flow (CMF): The CMF has been positive, indicating potential buying pressure in the stock.
Key Observations and Opinions:
- Trend: The trend indicators point towards a downward trajectory in the stock price.
- Momentum: Momentum indicators suggest a lack of strong momentum in either direction.
- Volatility: Volatility has been decreasing, indicating a potential period of consolidation.
- Volume: Volume indicators show mixed signals, with no clear trend in volume accumulation.
Conclusion:
Based on the analysis of the technical indicators, the stock price of SMX is likely to continue its downward trend in the coming days. The lack of strong momentum, decreasing volatility, and mixed volume signals suggest a period of consolidation or sideways movement. Investors should exercise caution and closely monitor the price action for any potential reversal signals before making any trading decisions.