Technical Analysis of SNAL 2024-05-31
Overview:
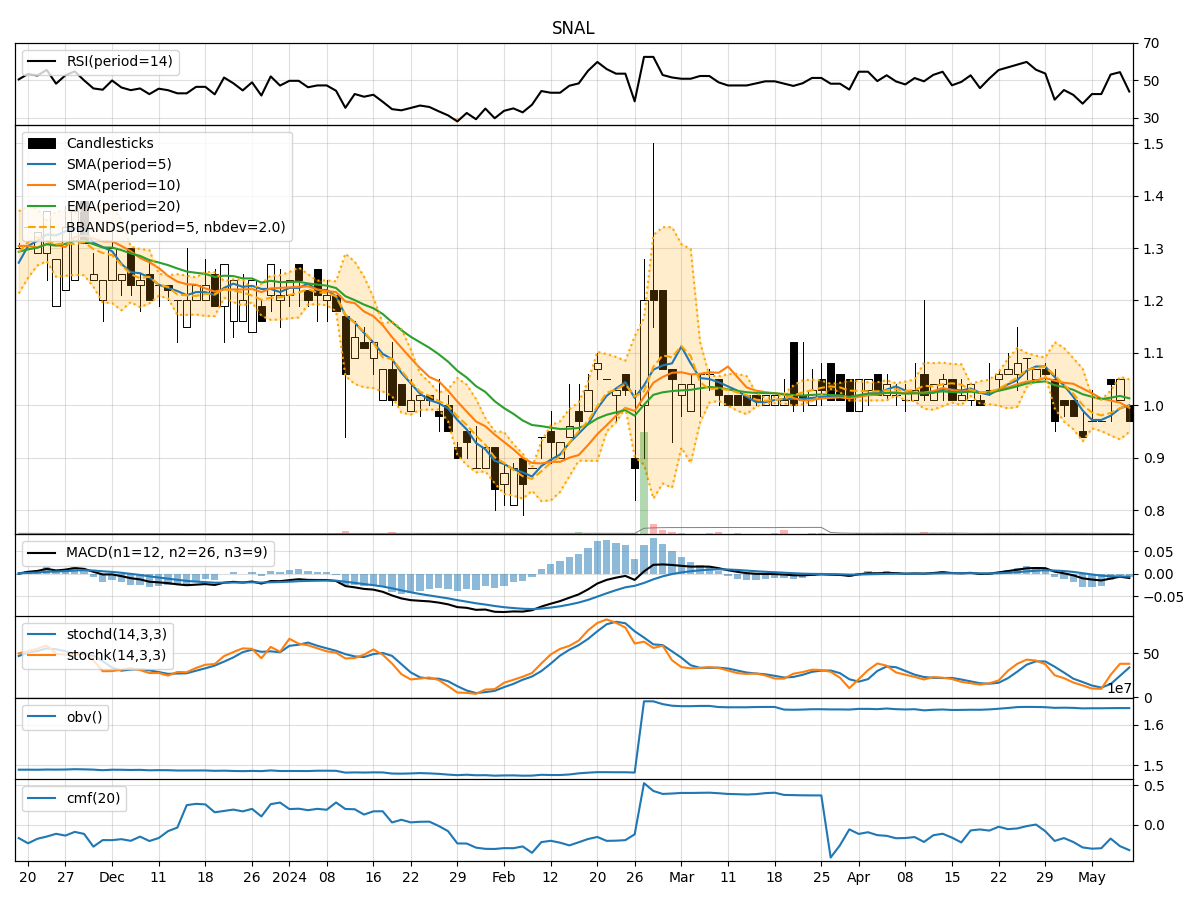
In analyzing the technical indicators for SNAL over the last 5 days, we will delve into the trend, momentum, volatility, and volume indicators to provide a comprehensive outlook on the possible stock price movement in the coming days. By examining these key indicators, we aim to offer valuable insights and predictions for potential investors.
Trend Analysis:
- Moving Averages (MA): The 5-day MA has been consistently below the closing prices, indicating a short-term downtrend.
- MACD: The MACD line has been negative, suggesting a bearish momentum in the stock.
- EMA: The EMA has been declining, further supporting the bearish trend in the stock.
Momentum Analysis:
- RSI: The RSI has been relatively low, indicating potential oversold conditions in the stock.
- Stochastic Oscillator: Both %K and %D have been trending lower, signaling weakening momentum.
- Williams %R: The indicator has been in the oversold territory, suggesting a possible reversal.
Volatility Analysis:
- Bollinger Bands (BB): The stock price has been trading within the lower Bollinger Band, indicating a period of low volatility.
- Bollinger Band Width: The Band Width has been narrowing, suggesting a potential breakout or significant price movement ahead.
Volume Analysis:
- On-Balance Volume (OBV): The OBV has been negative, indicating distribution and selling pressure in the stock.
- Chaikin Money Flow (CMF): The CMF has been consistently negative, reflecting a lack of buying interest.
Key Observations:
- The stock is currently in a downtrend based on moving averages and MACD.
- Momentum indicators suggest oversold conditions and weakening momentum.
- Volatility is low, but the narrowing Bollinger Bands indicate a potential breakout.
- Volume indicators show selling pressure and lack of buying interest.
Conclusion:
Based on the analysis of the technical indicators, the next few days' possible stock price movement for SNAL is likely to be sideways to slightly bearish. The stock may experience some consolidation or a minor pullback before potentially resuming its downtrend. Investors should exercise caution and consider waiting for more definitive signals before making any significant trading decisions.