Technical Analysis of SNCY 2024-05-10
Overview:
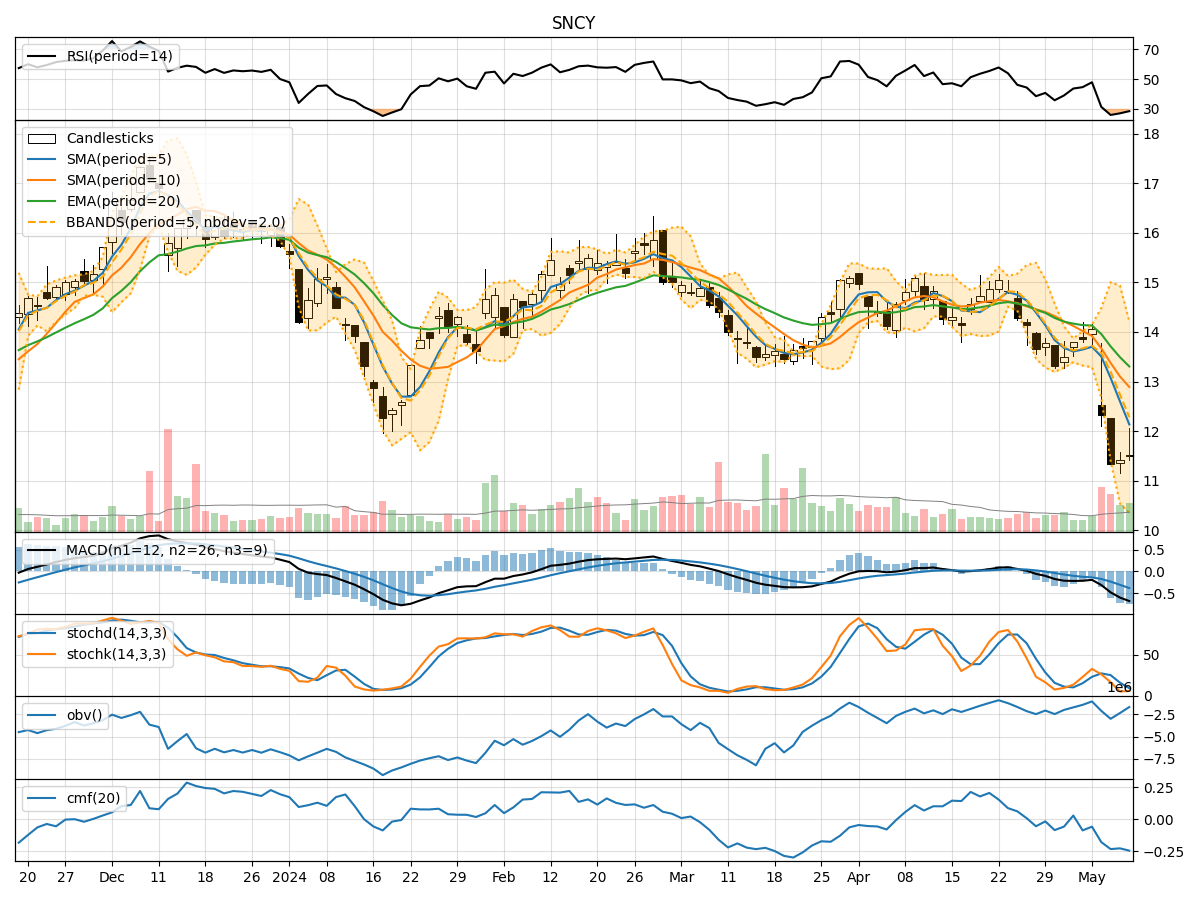
In analyzing the technical indicators for SNCY over the last 5 days, we will delve into the trend, momentum, volatility, and volume indicators to provide a comprehensive outlook on the possible stock price movement in the coming days.
Trend Indicators:
- Moving Averages (MA): The 5-day MA has been consistently below the closing price, indicating a short-term bearish trend.
- MACD: The MACD line has been below the signal line, suggesting a bearish momentum.
- EMA: The EMA has been declining, reflecting a bearish sentiment in the stock.
Momentum Indicators:
- RSI: The RSI has been below 50, indicating a bearish momentum in the stock.
- Stochastic Oscillator: Both %K and %D have been in oversold territory, signaling a potential reversal or continuation of the downtrend.
- Williams %R: The stock has been in oversold territory, suggesting a possible bounce back in the near term.
Volatility Indicators:
- Bollinger Bands (BB): The stock price has been consistently below the lower Bollinger Band, indicating oversold conditions.
- Bollinger %B: The %B has been below 0.2, suggesting a potential reversal or bounce back in the stock price.
Volume Indicators:
- On-Balance Volume (OBV): The OBV has been declining, indicating selling pressure in the stock.
- Chaikin Money Flow (CMF): The CMF has been negative, reflecting a bearish sentiment in the stock.
Key Observations:
- The stock is currently in a bearish trend based on moving averages, MACD, and EMA.
- Momentum indicators like RSI and Stochastic Oscillator suggest oversold conditions, potentially signaling a reversal.
- Volatility indicators show the stock is oversold, indicating a possible bounce back.
- Volume indicators reflect selling pressure and a bearish sentiment in the stock.
Conclusion:
Based on the analysis of the technical indicators, the stock is currently in a bearish phase with oversold conditions. However, the momentum indicators suggest a potential reversal in the near term. Traders should closely monitor the price action for any signs of a bounce back or continuation of the downtrend. It is advisable to wait for confirmation signals before making any trading decisions.