Technical Analysis of SNPS 2024-05-10
Overview:
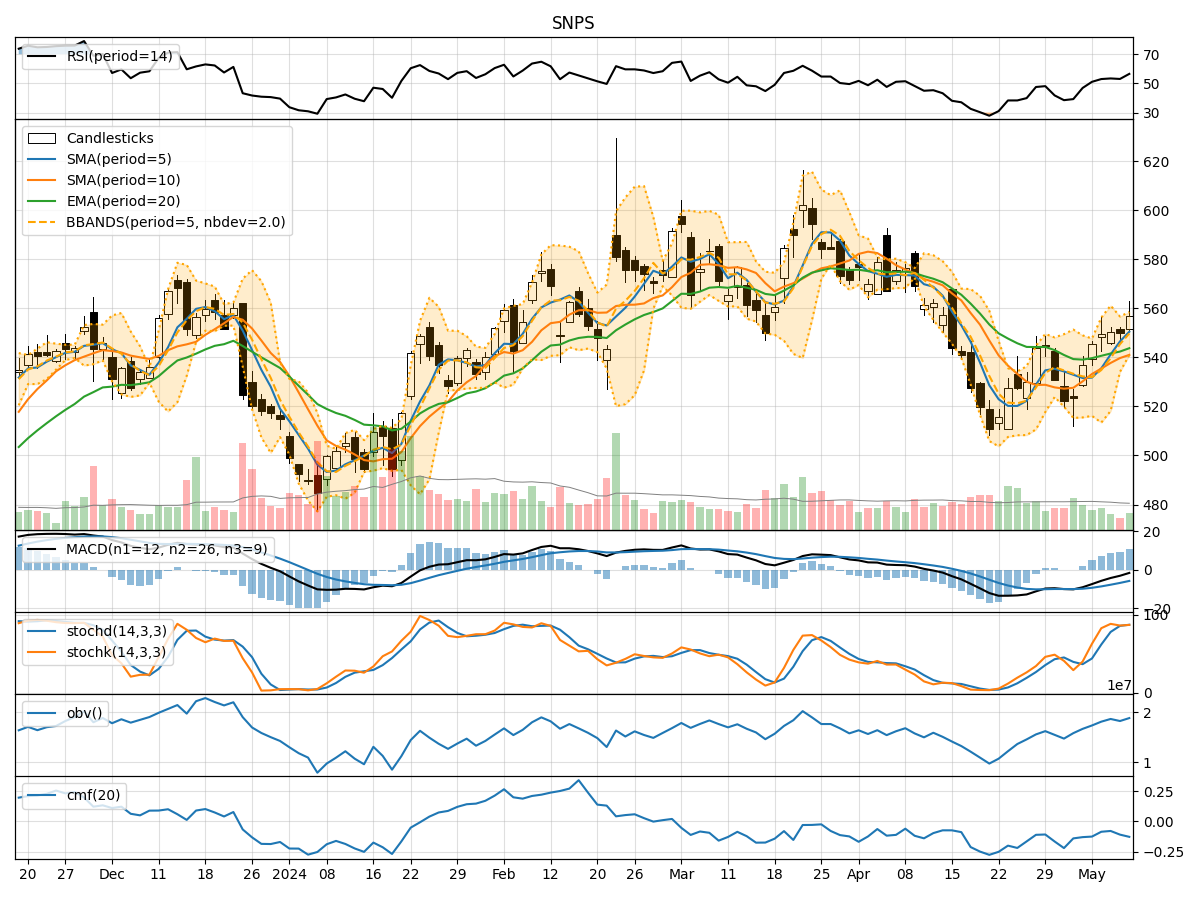
In analyzing the technical indicators for SNPS over the last 5 days, we will delve into the trend, momentum, volatility, and volume indicators to provide a comprehensive outlook on the possible stock price movement in the coming days. By examining these key indicators, we aim to offer valuable insights and predictions for potential investors and traders.
Trend Indicators:
- Moving Averages (MA): The 5-day Moving Average (MA) has been consistently rising, indicating a bullish trend in the short term.
- MACD: The Moving Average Convergence Divergence (MACD) has shown positive values, suggesting bullish momentum.
- EMA: The Exponential Moving Average (EMA) has been trending upwards, supporting the bullish sentiment.
Momentum Indicators:
- RSI: The Relative Strength Index (RSI) has been fluctuating around the neutral zone, indicating indecision in the market.
- Stochastic Oscillator: Both %K and %D have been in the overbought territory, signaling a potential reversal.
- Williams %R: The Williams %R is also in the oversold region, hinting at a possible bearish reversal.
Volatility Indicators:
- Bollinger Bands: The Bollinger Bands have been narrowing, suggesting decreasing volatility and a potential breakout.
- Bollinger %B: The %B indicator has been fluctuating, indicating uncertainty in price direction.
Volume Indicators:
- On-Balance Volume (OBV): The OBV has been fluctuating, reflecting mixed buying and selling pressure.
- Chaikin Money Flow (CMF): The CMF has been negative, indicating outflow of money from the stock.
Key Observations and Opinions:
- Trend: The trend indicators suggest a bullish sentiment in the short term.
- Momentum: Mixed signals from momentum indicators indicate a potential reversal or consolidation.
- Volatility: Decreasing volatility may precede a significant price movement.
- Volume: The volume indicators show mixed signals, reflecting uncertainty in market participation.
Conclusion:
Based on the analysis of the technical indicators, the stock of SNPS is likely to experience sideways consolidation in the coming days. The bullish trend may face resistance due to overbought conditions in momentum indicators and uncertainty in volume and volatility indicators. Traders should exercise caution and wait for clearer signals before making significant trading decisions.