Technical Analysis of SNT 2024-05-10
Overview:
In analyzing the technical indicators for SNT over the last 5 days, we will delve into the trend, momentum, volatility, and volume indicators to provide a comprehensive outlook on the possible stock price movement in the coming days. By examining these key aspects, we aim to offer valuable insights and predictions for informed decision-making.
Trend Analysis:
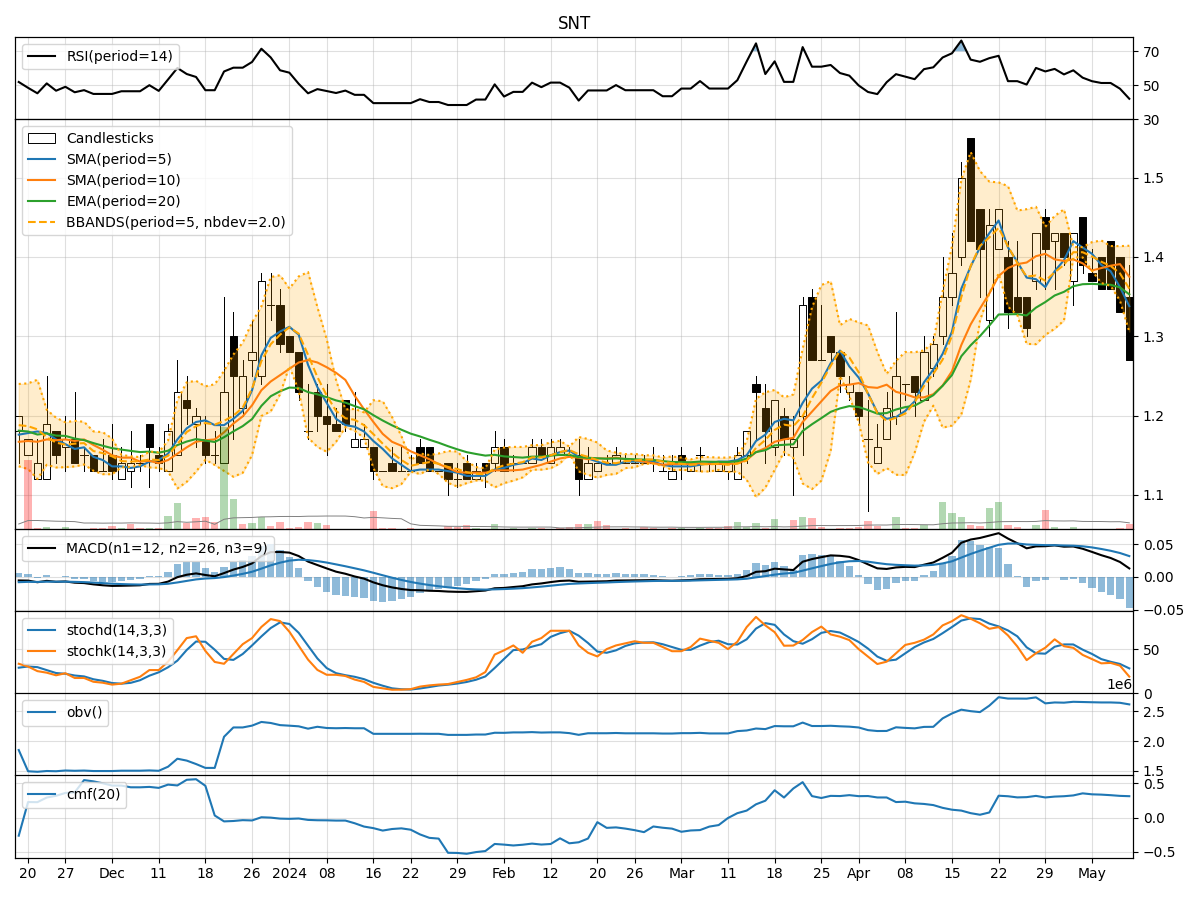
- Moving Averages (MA): The 5-day MA has been consistently decreasing, indicating a downward trend in the stock price.
- MACD: The MACD line has been positive but decreasing, while the MACD Histogram has been consistently negative, suggesting a weakening bullish momentum.
Momentum Analysis:
- RSI: The RSI has been declining and is currently below 50, indicating a bearish momentum.
- Stochastic Oscillator: Both %K and %D have been decreasing, signaling a bearish sentiment in the market.
Volatility Analysis:
- Bollinger Bands (BB): The stock price has been trading below the lower Bollinger Band, indicating oversold conditions and potential for a reversal.
Volume Analysis:
- On-Balance Volume (OBV): The OBV has been decreasing, suggesting selling pressure in the market.
- Chaikin Money Flow (CMF): The CMF has been declining, indicating a decrease in buying pressure.
Key Observations:
- The stock is currently in a downtrend based on moving averages and MACD analysis.
- Momentum indicators such as RSI and Stochastic Oscillator suggest a bearish sentiment in the market.
- Volatility indicators like Bollinger Bands indicate oversold conditions, potentially leading to a reversal.
- Volume indicators OBV and CMF point towards selling pressure dominating the market sentiment.
Conclusion:
Based on the analysis of the technical indicators, the next few days are likely to see a continuation of the downward trend in SNT stock price. The bearish momentum indicated by RSI and Stochastic Oscillator, coupled with the selling pressure highlighted by OBV and CMF, suggests that the stock may experience further downside movement. Traders and investors should exercise caution and consider short-term strategies aligned with the prevailing bearish market sentiment.