Technical Analysis of SNY 2024-05-10
Overview:
In analyzing the technical indicators for SNY over the last 5 days, we will delve into the trend, momentum, volatility, and volume indicators to provide a comprehensive outlook on the possible stock price movement in the coming days. By examining these key factors, we aim to offer valuable insights and predictions for potential investors.
Trend Indicators:
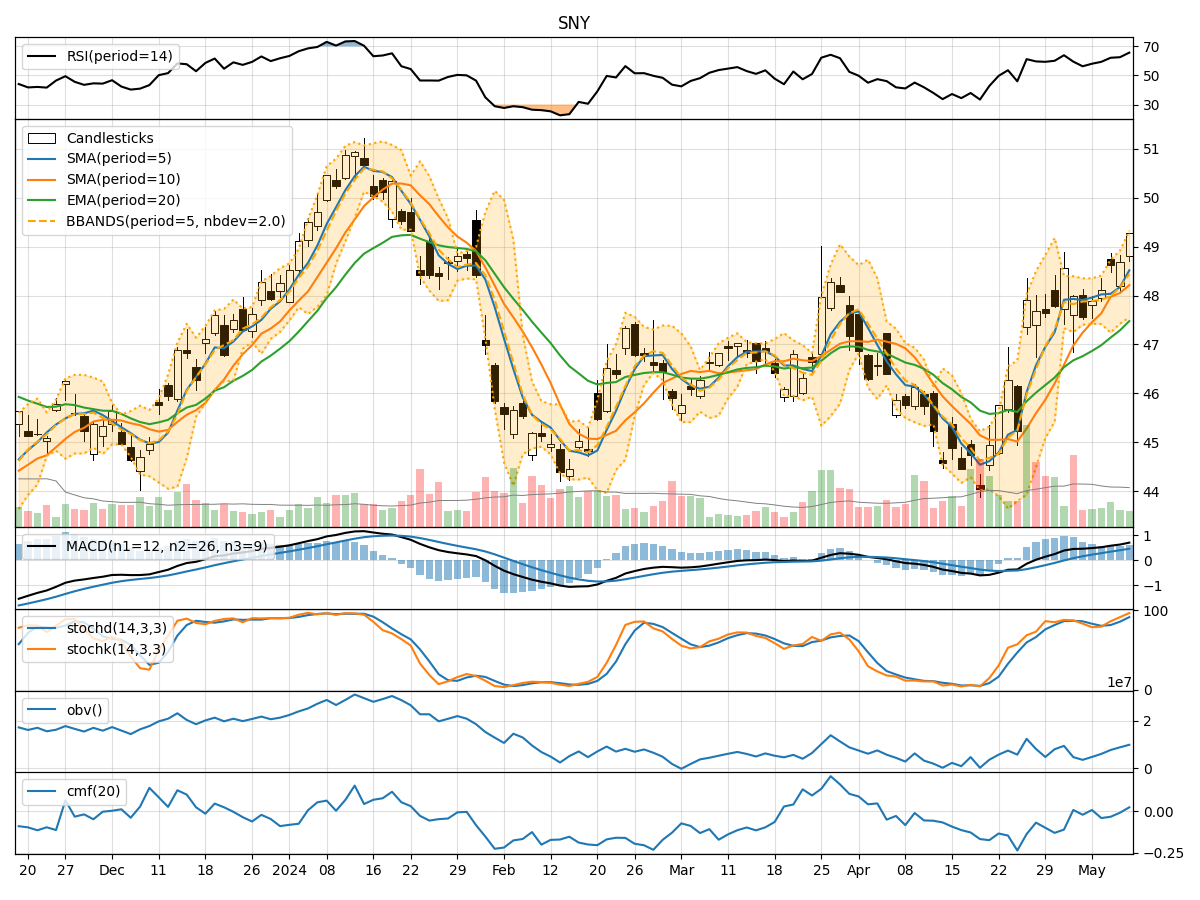
- Moving Averages (MA): The 5-day Moving Average has been consistently rising, indicating a bullish trend in the short term.
- MACD: The MACD line has been increasing, crossing above the signal line, suggesting a bullish momentum.
- EMA: The Exponential Moving Average has been trending upwards, supporting the bullish sentiment.
Momentum Indicators:
- RSI: The Relative Strength Index has been climbing, reaching above 50, indicating increasing buying pressure.
- Stochastic Oscillator: Both %K and %D have been rising, showing strong bullish momentum.
- Williams %R: The indicator has been moving towards the oversold region, potentially signaling a reversal.
Volatility Indicators:
- Bollinger Bands: The bands have been widening, suggesting increased volatility in the stock price.
- Bollinger %B: The %B indicator has been fluctuating within the bands, indicating potential price reversals.
Volume Indicators:
- On-Balance Volume (OBV): The OBV has been mostly positive, indicating accumulation by investors.
- Chaikin Money Flow (CMF): The CMF has been mixed, showing some distribution in the short term.
Key Observations:
- The trend indicators point towards a bullish sentiment, supported by the moving averages and MACD.
- Momentum indicators suggest strong buying pressure and bullish momentum in the stock.
- Volatility indicators indicate increased price fluctuations, potentially leading to both upside and downside movements.
- Volume indicators show a mix of accumulation and distribution, reflecting uncertainty in investor sentiment.
Conclusion:
Based on the analysis of the technical indicators, the overall outlook for SNY in the next few days is bullish. The trend is positive, momentum is strong, and volatility is increasing, which could lead to potential price swings. Investors should consider entering long positions or holding onto existing positions to capitalize on the expected upward movement in the stock price. However, it is essential to monitor the indicators closely for any signs of reversal or consolidation.