Technical Analysis of SOGP 2024-05-10
Overview:
In analyzing the technical indicators for SOGP over the last 5 days, we will delve into the trend, momentum, volatility, and volume indicators to provide a comprehensive outlook on the possible stock price movement. By examining these key aspects, we aim to offer valuable insights and predictions for the upcoming days.
Trend Analysis:
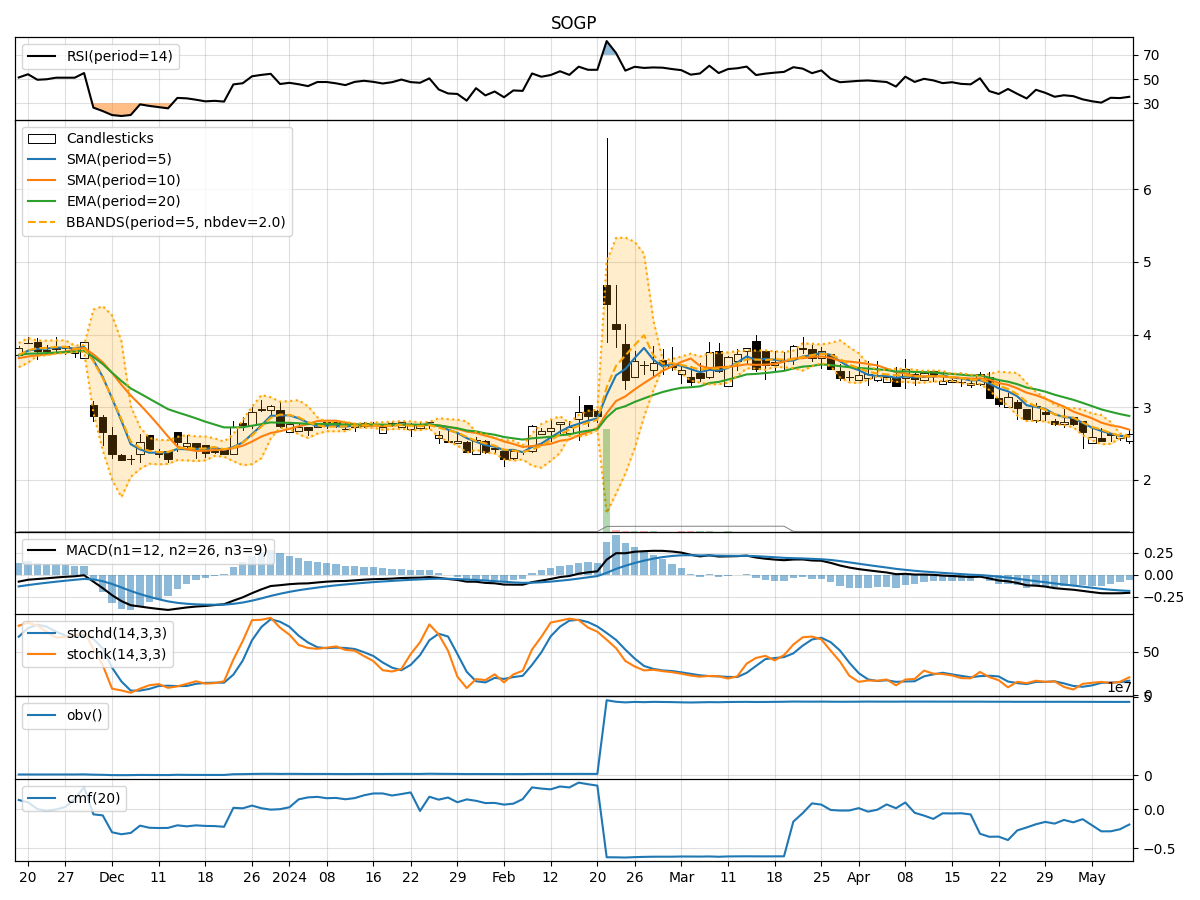
- Moving Averages (MA): The 5-day MA has been consistently below the closing prices, indicating a downward trend.
- MACD: The MACD line has been negative, with the MACD histogram showing a decreasing trend over the past 5 days.
- EMA: The EMA has been declining, further confirming the bearish trend.
Key Observation: The trend indicators suggest a bearish outlook for SOGP based on the moving averages, MACD, and EMA.
Momentum Analysis:
- RSI: The RSI values have been relatively low, indicating bearish momentum.
- Stochastic Oscillator: Both %K and %D values have been in the oversold territory, signaling a potential reversal.
- Williams %R: The indicator has been consistently in the oversold region, reflecting strong bearish momentum.
Key Observation: Momentum indicators point towards a bearish sentiment with potential signs of a reversal due to the oversold conditions.
Volatility Analysis:
- Bollinger Bands (BB): The bands have been narrowing, suggesting decreasing volatility.
- BB %B: The %B values have been declining, indicating a decrease in volatility.
- BB Width: The width of the bands has been contracting, signaling reduced price fluctuations.
Key Observation: Volatility indicators show a decreasing trend, implying a potential period of consolidation or stability in the stock price.
Volume Analysis:
- On-Balance Volume (OBV): The OBV has been fluctuating but has not shown a clear trend.
- Chaikin Money Flow (CMF): The CMF values have been negative, indicating selling pressure in the stock.
Key Observation: Volume indicators suggest mixed signals with no clear direction in volume flow.
Conclusion:
Based on the analysis of trend, momentum, volatility, and volume indicators, the overall outlook for SOGP in the next few days leans towards a bearish sentiment. The trend indicators, momentum signals, and volume analysis all point towards a continued downward pressure on the stock price. However, the decreasing volatility could lead to a period of consolidation before any potential trend reversal.
Key Conclusion: The next few days are likely to see downward movement in SOGP, with a possibility of consolidation before a potential reversal. Traders should exercise caution and closely monitor key support levels for any signs of a trend shift.