Technical Analysis of SOPH 2024-05-10
Overview:
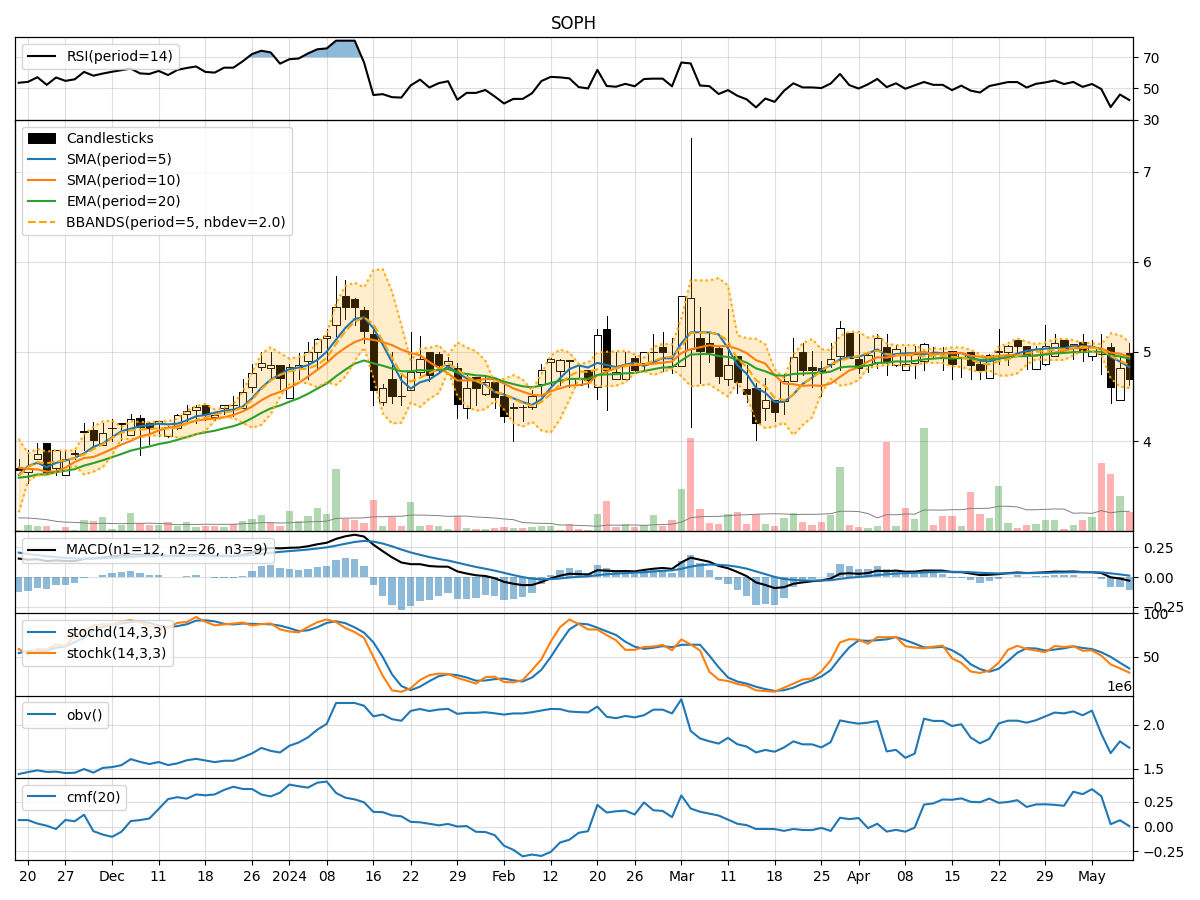
In analyzing the technical indicators for SOPH over the last 5 days, we will delve into the trend, momentum, volatility, and volume indicators to provide a comprehensive outlook on the possible stock price movement in the coming days.
Trend Analysis:
- Moving Averages (MA): The 5-day MA has been declining, indicating a short-term bearish trend.
- MACD: The MACD line has been consistently negative, suggesting a bearish momentum.
- RSI: The RSI has been fluctuating around the 50 level, indicating indecision in the market.
Momentum Analysis:
- Stochastic Oscillator: Both %K and %D have been decreasing, signaling a bearish momentum.
- Williams %R: The indicator has been in oversold territory, suggesting a potential reversal.
Volatility Analysis:
- Bollinger Bands: The stock price has been trading below the lower Bollinger Band, indicating oversold conditions.
- Volatility: The volatility has been decreasing, which could lead to a potential price reversal.
Volume Analysis:
- On-Balance Volume (OBV): The OBV has been declining, indicating selling pressure.
- Chaikin Money Flow (CMF): The CMF has been relatively low, suggesting a lack of buying interest.
Key Observations:
- The stock is currently in a bearish trend based on moving averages and MACD.
- Momentum indicators like Stochastic Oscillator and Williams %R are signaling a bearish bias.
- Volatility is low, but the stock is oversold according to Bollinger Bands.
- Volume indicators show a decrease in buying interest.
Conclusion:
Based on the analysis of the technical indicators, the outlook for SOPH in the next few days is bearish. The stock is likely to continue its downward trend, with potential for further price declines. Traders should exercise caution and consider shorting or staying on the sidelines until a clear reversal pattern emerges.