Technical Analysis of SPRC 2024-05-10
Overview:
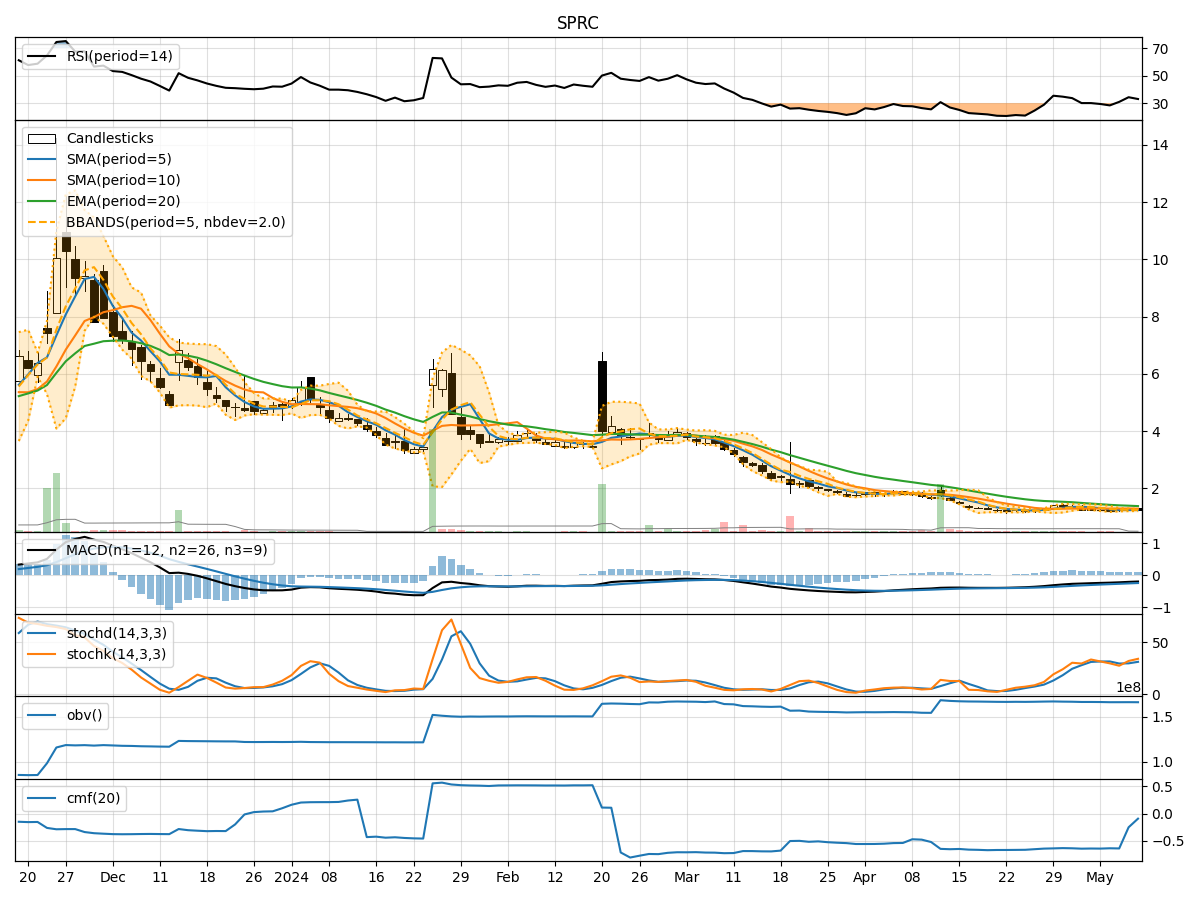
In analyzing the technical indicators for SPRC over the last 5 days, we will delve into the trend, momentum, volatility, and volume indicators to provide a comprehensive assessment of the stock's potential price movement. By examining these key factors, we aim to offer valuable insights and predictions for the next few days.
Trend Analysis:
- Moving Averages (MA): The 5-day MA has been consistently below the closing price, indicating a short-term downtrend.
- MACD: The MACD line has been negative, suggesting bearish momentum in the stock.
- EMA: The EMA has been declining, further supporting the bearish trend.
Key Observation: The trend indicators point towards a downward trajectory for SPRC.
Momentum Analysis:
- RSI: The RSI has been relatively low, indicating bearish momentum.
- Stochastic Oscillator: Both %K and %D have been trending downwards, signaling weakening momentum.
- Williams %R: The indicator has been in oversold territory, suggesting a potential reversal.
Key Observation: Momentum indicators align with the bearish sentiment in the stock.
Volatility Analysis:
- Bollinger Bands: The stock price has been trading within the lower Bollinger Band, indicating lower volatility.
- Bollinger %B: The %B has been below 0.5, suggesting the stock is oversold.
Key Observation: Volatility indicators imply a sideways or oversold market condition.
Volume Analysis:
- On-Balance Volume (OBV): The OBV has been relatively stable, indicating no significant divergence between volume and price movement.
- Chaikin Money Flow (CMF): The CMF has been negative, reflecting selling pressure.
Key Observation: Volume indicators do not show a clear direction but hint at selling pressure.
Conclusion:
Based on the analysis of trend, momentum, volatility, and volume indicators, the overall outlook for SPRC in the next few days is bearish. The stock is likely to continue its downward trend with potential for further decline. Traders should exercise caution and consider shorting or staying on the sidelines until a clear reversal signal emerges.
Key Conclusion:
The technical analysis suggests that SPRC is likely to experience further downward movement in the coming days. Traders should consider adopting a bearish stance and monitor for potential entry points to capitalize on the expected price decline.