Technical Analysis of SPT 2024-05-10
Overview:
In analyzing the technical indicators for SPT stock over the last 5 days, we will delve into the trend, momentum, volatility, and volume indicators to provide a comprehensive outlook on the possible stock price movement in the coming days. By examining these key indicators, we aim to offer valuable insights and predictions for potential investors.
Trend Analysis:
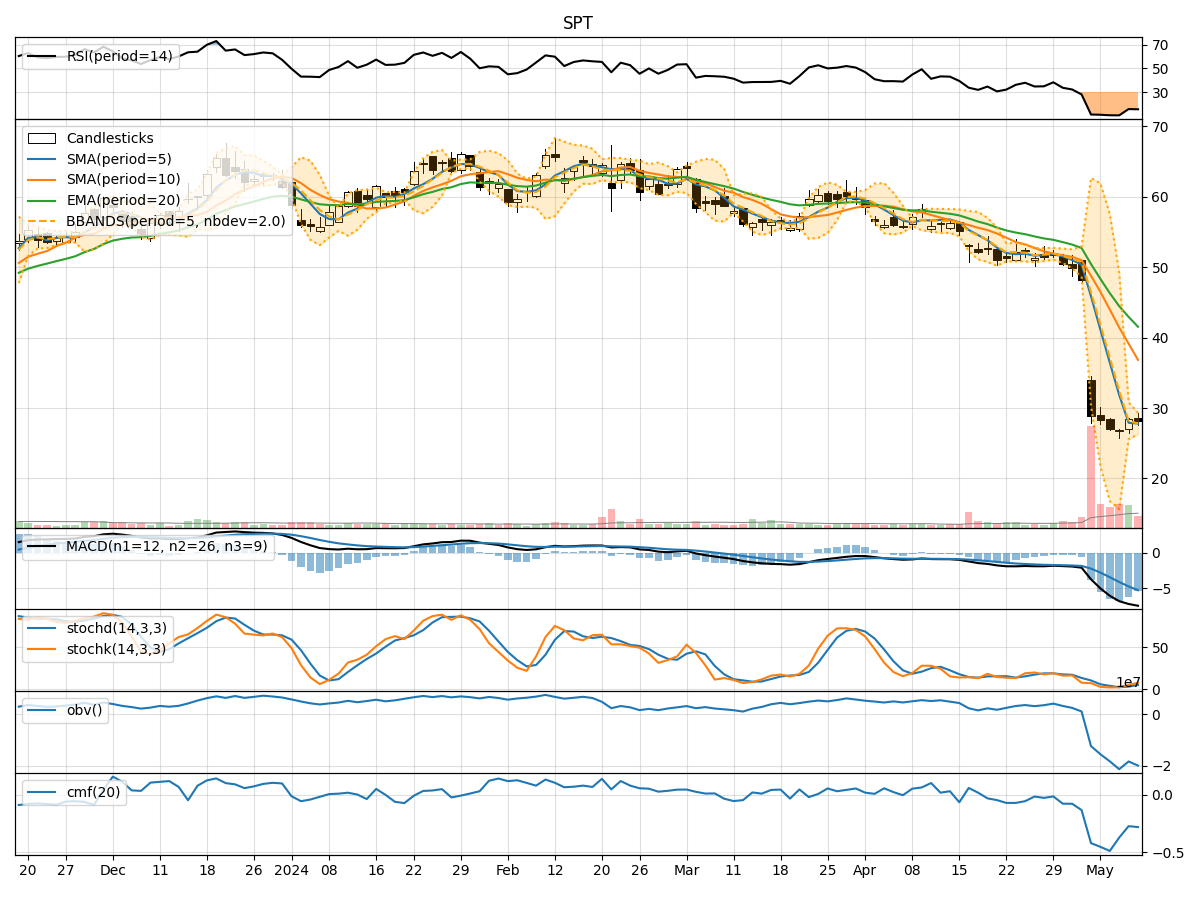
- Moving Averages (MA): The 5-day moving average has been consistently decreasing, indicating a downward trend in the stock price.
- MACD: The MACD line has been negative and decreasing, suggesting bearish momentum in the stock.
- EMA: The exponential moving average has also been declining, reinforcing the bearish sentiment in the stock.
Momentum Analysis:
- RSI: The Relative Strength Index has been low, indicating oversold conditions in the stock.
- Stochastic Oscillator: Both %K and %D have been in the oversold territory, signaling a potential reversal in the stock price.
- Williams %R: The Williams %R is deeply in the oversold region, suggesting a possible bounce back in the stock price.
Volatility Analysis:
- Bollinger Bands: The Bollinger Bands have widened, indicating increased volatility in the stock price.
- Bollinger %B: The %B indicator is below 0.2, signifying that the stock is oversold and may see a reversal soon.
Volume Analysis:
- On-Balance Volume (OBV): The OBV has been consistently negative, reflecting selling pressure in the stock.
- Chaikin Money Flow (CMF): The CMF has been negative, indicating outflow of money from the stock.
Key Observations and Opinions:
- Trend: The stock is in a clear downtrend based on moving averages and MACD.
- Momentum: The momentum indicators suggest that the stock is oversold and may see a potential reversal.
- Volatility: Increased volatility is observed, which could lead to sharp price movements.
- Volume: The negative OBV and CMF indicate bearish sentiment and selling pressure in the stock.
Conclusion:
Based on the analysis of the technical indicators, the next few days' possible stock price movement for SPT is likely to see a short-term bounce back or reversal. The oversold conditions indicated by momentum indicators, coupled with the widening Bollinger Bands, suggest a potential uptick in the stock price. However, investors should remain cautious as the overall trend is still bearish, and further confirmation is needed to validate a sustained upward movement.