Technical Analysis of SRCL 2024-05-10
Overview:
In analyzing the technical indicators for SRCL over the last 5 days, we will delve into the trend, momentum, volatility, and volume indicators to provide a comprehensive outlook on the possible stock price movement in the coming days.
Trend Indicators:
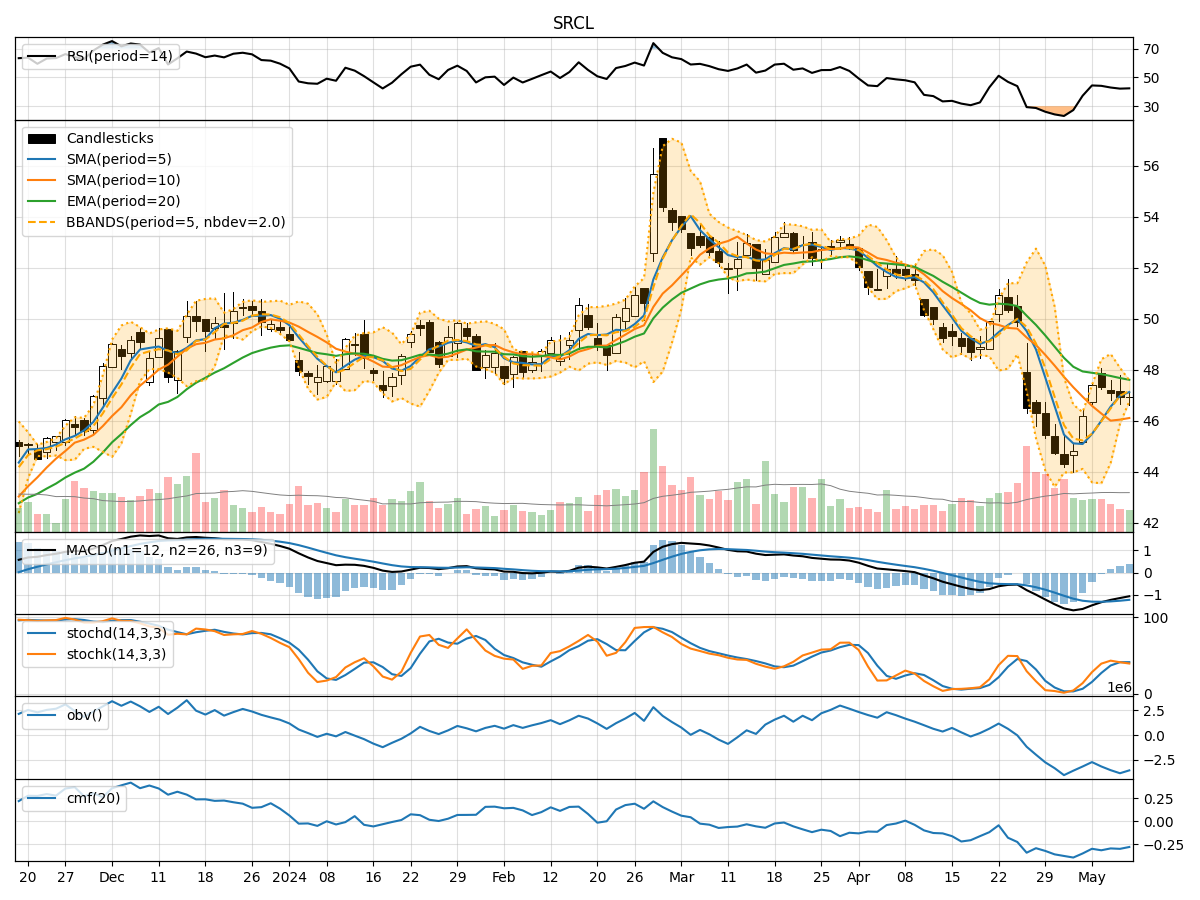
- Moving Averages (MA): The 5-day MA has been showing an upward trend, indicating a positive momentum in the short term.
- MACD: The MACD has been consistently negative, suggesting a bearish sentiment in the stock.
- EMA: The EMA has been declining, reflecting a weakening trend in the stock price.
Momentum Indicators:
- RSI: The RSI has been decreasing, signaling a potential oversold condition in the stock.
- Stochastic Oscillator: Both %K and %D have been declining, indicating a bearish momentum.
- Williams %R: The Williams %R is in the oversold territory, suggesting a possible reversal in the stock price.
Volatility Indicators:
- Bollinger Bands: The stock price has been trading within the lower Bollinger Band, indicating a potential oversold condition.
- Bollinger %B: The %B is below 0.2, suggesting a possible undervalued situation in the stock.
Volume Indicators:
- On-Balance Volume (OBV): The OBV has been decreasing, indicating a selling pressure in the stock.
- Chaikin Money Flow (CMF): The CMF has been negative, reflecting a bearish sentiment in the stock.
Key Observations and Opinions:
- Trend: The trend indicators show a mixed signal with the MA indicating a short-term positive trend, while the MACD and EMA suggest a bearish sentiment in the stock.
- Momentum: The momentum indicators point towards a bearish momentum with decreasing RSI and Stochastic Oscillator values.
- Volatility: The stock is currently in an oversold condition based on the Bollinger Bands and %B indicator.
- Volume: The decreasing OBV and negative CMF indicate a selling pressure in the stock.
Conclusion:
Based on the analysis of the technical indicators, the stock is currently in a bearish phase with a potential for further downside movement in the coming days. Traders and investors should exercise caution and consider waiting for a reversal confirmation before considering any long positions. The stock may experience further downward pressure before showing signs of a potential reversal.