Technical Analysis of STBX 2024-05-10
Overview:
In analyzing the technical indicators for STBX over the last 5 days, we will delve into the trend, momentum, volatility, and volume indicators to provide a comprehensive outlook on the possible stock price movement in the coming days. By examining these key indicators, we aim to offer valuable insights and predictions for informed decision-making.
Trend Analysis:
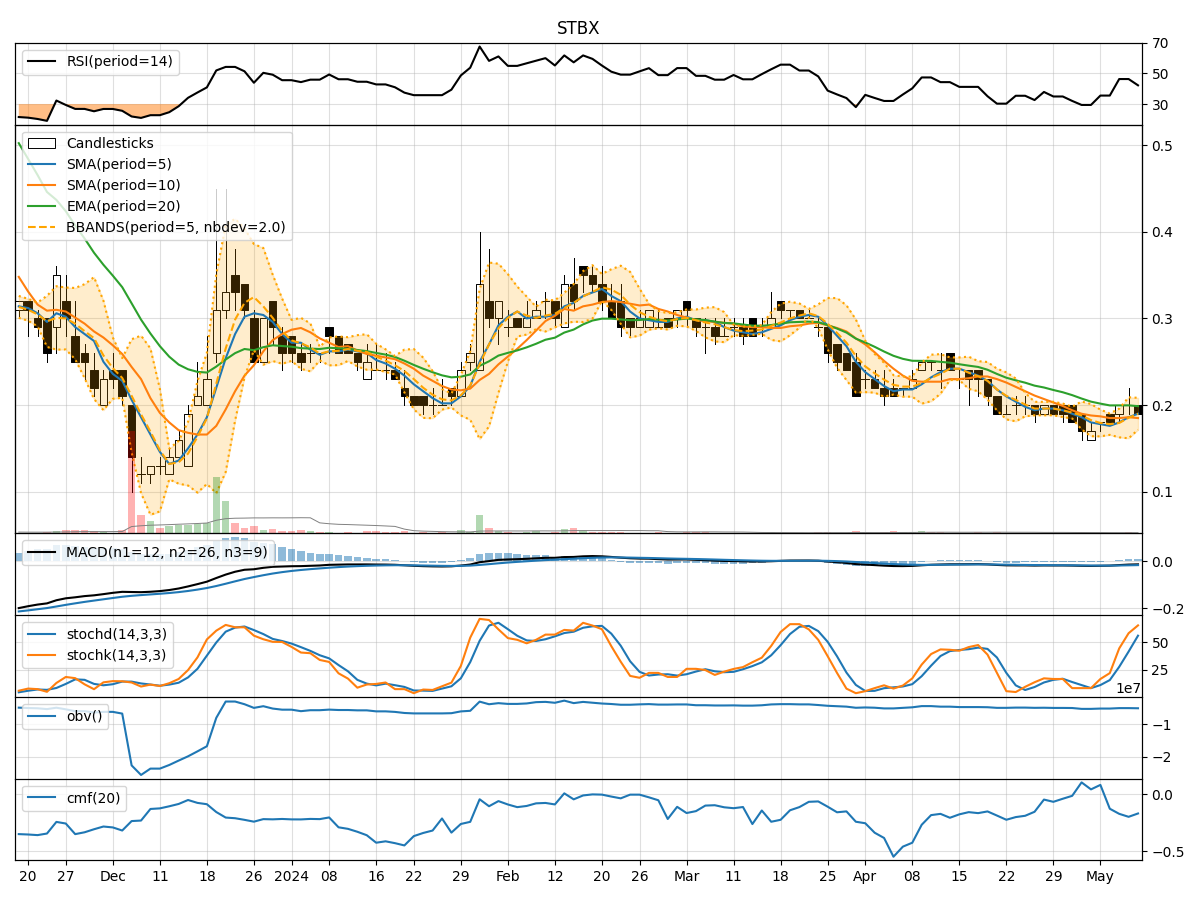
- Moving Averages (MA): The 5-day MA has been fluctuating around the closing prices, indicating short-term price trends. The SMA(10) and EMA(20) show a slight downward trend, suggesting a potential bearish sentiment.
- MACD: The MACD line has been negative, with the MACD histogram showing a slight increase in the last few days. This could signal a potential reversal in the bearish momentum.
Momentum Analysis:
- RSI: The RSI has been hovering around 40-50, indicating a neutral sentiment with no extreme overbought or oversold conditions.
- Stochastic Oscillator: The Stochastics have been rising, reaching near overbought levels, suggesting a potential bullish momentum.
- Williams %R: The Williams %R is in the oversold territory, indicating a potential reversal to the upside.
Volatility Analysis:
- Bollinger Bands: The Bollinger Bands have been narrowing, indicating decreasing volatility. The price has been trading within the bands, suggesting a period of consolidation.
- Bollinger %B: The %B indicator is around 0.5, indicating the price is at the middle of the bands, further supporting the consolidation phase.
Volume Analysis:
- On-Balance Volume (OBV): The OBV has been fluctuating, showing no clear trend in volume accumulation or distribution.
- Chaikin Money Flow (CMF): The CMF has been negative, indicating a bearish money flow in the stock.
Conclusion:
Based on the analysis of the technical indicators, the stock price of STBX is likely to experience sideways movement in the next few days. The trend indicators suggest a potential bearish sentiment, while the momentum indicators show conflicting signals with a mix of bullish and bearish indications. The volatility indicators point towards a period of consolidation, supported by the volume indicators showing no clear accumulation or distribution trend.
Recommendation:
- Caution: Traders should exercise caution and closely monitor the price action for any potential breakout from the consolidation phase.
- Wait for Confirmation: It is advisable to wait for confirmation from key indicators before taking any significant trading positions.
- Risk Management: Implement proper risk management strategies to mitigate potential losses in case of unexpected price movements.
In conclusion, the overall outlook for STBX indicates a neutral to slightly bearish bias in the short term, with a high probability of sideways price movement.