Technical Analysis of STKL 2024-05-31
Overview:
In analyzing the technical indicators for STKL over the last 5 days, we will delve into the trend, momentum, volatility, and volume indicators to provide a comprehensive outlook on the possible stock price movement in the coming days. By examining these key aspects, we aim to offer valuable insights and predictions for informed decision-making.
Trend Analysis:
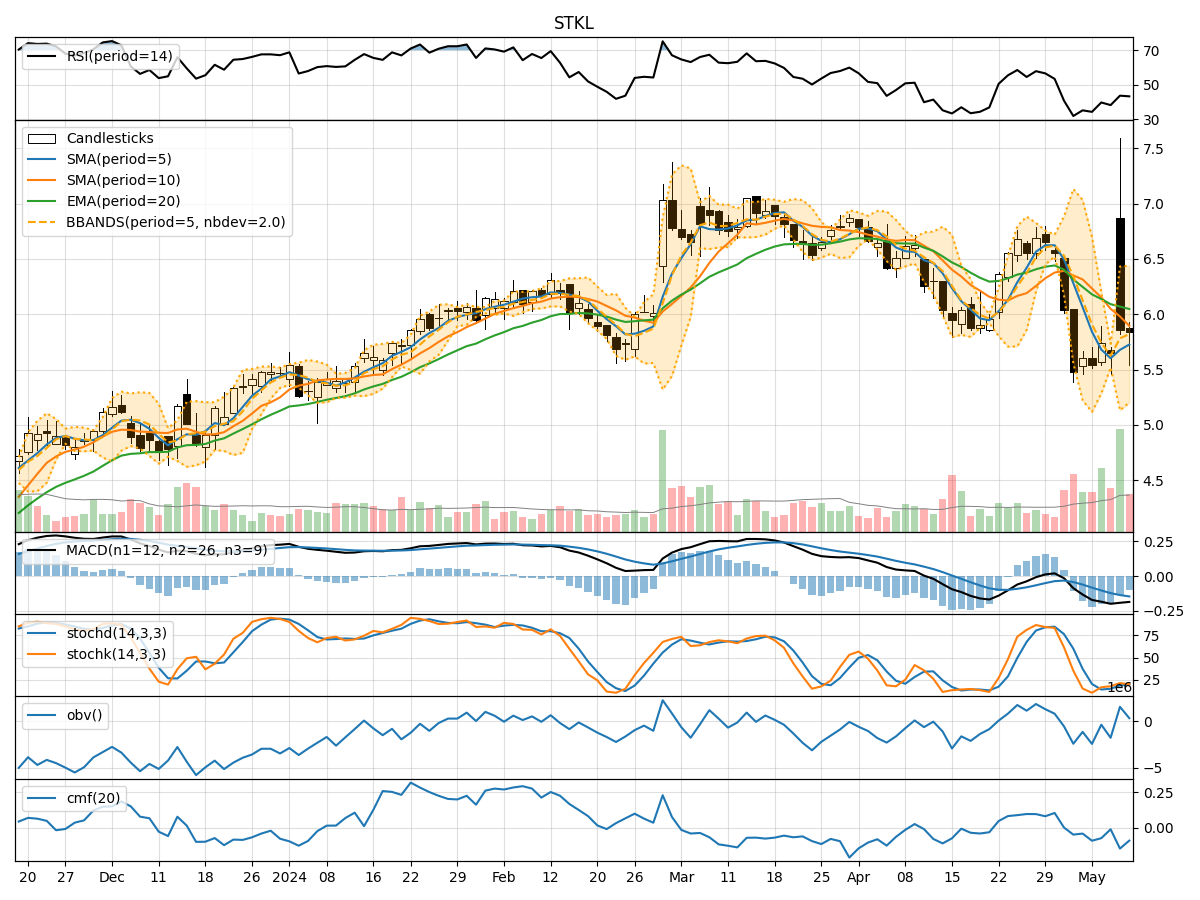
- Moving Averages (MA): The 5-day MA has been fluctuating around the closing prices, indicating short-term price trends. The SMA(10) and EMA(20) show a downward trend, suggesting a bearish sentiment in the medium to long term.
- MACD and Signal Line: The MACD has been negative, with the MACD line consistently below the signal line, indicating a bearish trend in momentum.
Momentum Analysis:
- RSI: The RSI has been gradually increasing but remains below the overbought threshold, indicating a potential for further upward movement.
- Stochastic Oscillator: Both %K and %D have been rising, suggesting increasing buying pressure and potential for further price appreciation.
Volatility Analysis:
- Bollinger Bands (BB): The bands have been widening, indicating increased price volatility. The current price is near the upper band, suggesting a potential overbought condition.
Volume Analysis:
- On-Balance Volume (OBV): The OBV has been fluctuating, indicating indecision among investors regarding the stock.
- Chaikin Money Flow (CMF): The CMF has been negative, indicating selling pressure in the market.
Key Observations:
- The trend indicators suggest a bearish sentiment in the medium to long term.
- Momentum indicators show a potential for short-term upward movement.
- Volatility is increasing, indicating potential price fluctuations.
- Volume indicators reflect indecision among investors and selling pressure.
Conclusion:
Based on the analysis of the technical indicators, the stock price of STKL is likely to experience short-term upward movement due to the positive momentum indicators such as rising RSI and Stochastic Oscillator. However, the overall trend remains bearish, as indicated by the moving averages and MACD. The increasing volatility and negative CMF suggest a cautious approach, and investors should closely monitor the price action for any signs of reversal. Exercise caution and consider short-term trading strategies in light of the mixed signals from the technical indicators.