Technical Analysis of STOK 2024-05-10
Overview:
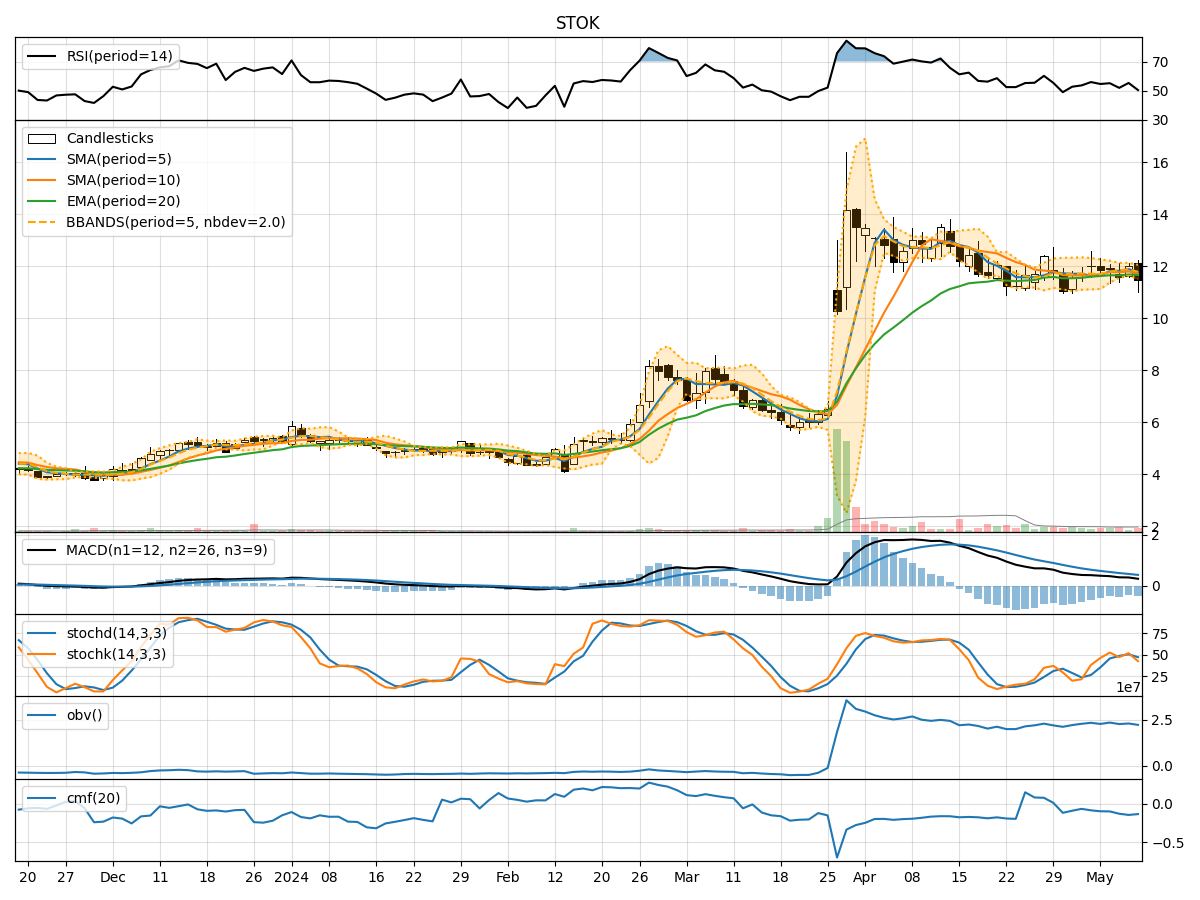
In analyzing the technical indicators for the stock over the last 5 days, we will delve into the trend, momentum, volatility, and volume indicators to provide a comprehensive outlook on the possible future stock price movement. By examining these key indicators, we aim to offer valuable insights and predictions for the upcoming trading days.
Trend Analysis:
- Moving Averages (MA): The 5-day Moving Average (MA) has been fluctuating around the closing prices, indicating short-term price trends. The Simple Moving Average (SMA) and Exponential Moving Average (EMA) have shown slight variations but have not diverged significantly.
- MACD: The Moving Average Convergence Divergence (MACD) has been positive, suggesting bullish momentum in the stock price. The MACD Histogram (MACDH) has been fluctuating around the zero line, indicating potential shifts in momentum.
Momentum Analysis:
- RSI: The Relative Strength Index (RSI) has been hovering around the mid-level, indicating a balanced momentum between buying and selling pressure.
- Stochastic Oscillator: Both %K and %D of the Stochastic Oscillator have shown mixed signals, with %K indicating potential oversold conditions in the stock.
- Williams %R: The Williams %R has been in the oversold territory, suggesting a possible reversal in the stock price.
Volatility Analysis:
- Bollinger Bands (BB): The Bollinger Bands have shown narrowing bands, indicating decreasing volatility in the stock price. The %B indicator has been fluctuating within a narrow range, suggesting a period of consolidation.
- Average True Range (ATR): The ATR has shown a decrease in volatility, indicating a potential stabilization in price movements.
Volume Analysis:
- On-Balance Volume (OBV): The OBV indicator has shown a slight decrease, suggesting a divergence between price and volume movements.
- Chaikin Money Flow (CMF): The CMF has been negative, indicating selling pressure in the stock.
Conclusion:
Based on the analysis of the technical indicators, the stock is currently exhibiting mixed signals across different categories. The trend indicators suggest a neutral stance with slight bullish momentum. The momentum indicators show a balanced momentum with potential oversold conditions. The volatility indicators point towards decreasing volatility and a period of consolidation. The volume indicators indicate a divergence between price and volume movements.
Overall Assessment:
- Trend: Neutral
- Momentum: Mixed
- Volatility: Consolidation
- Volume: Divergence
Possible Future Stock Price Movement:
Considering the mixed signals from the technical indicators, the stock is likely to experience sideways movement in the next few trading days. Traders and investors should closely monitor key support and resistance levels for potential breakout opportunities. It is advisable to wait for clearer signals or confirmation from the indicators before making significant trading decisions.